. 2019 Apr 16:10:466.
doi: 10.3389/fpls.2019.00466. eCollection 2019.

Phylogenetic Analyses and GAGA-Motif Binding Studies of BBR/BPC Proteins Lend to Clues in GAGA-Motif Recognition and a Regulatory Role in Brassinosteroid Signaling

Affiliations

Phylogenetic Analyses and GAGA-Motif Binding Studies of BBR/BPC Proteins Lend to Clues in GAGA-Motif Recognition and a Regulatory Role in Brassinosteroid Signaling

Marius L Theune et al. Front Plant Sci. .

Abstract

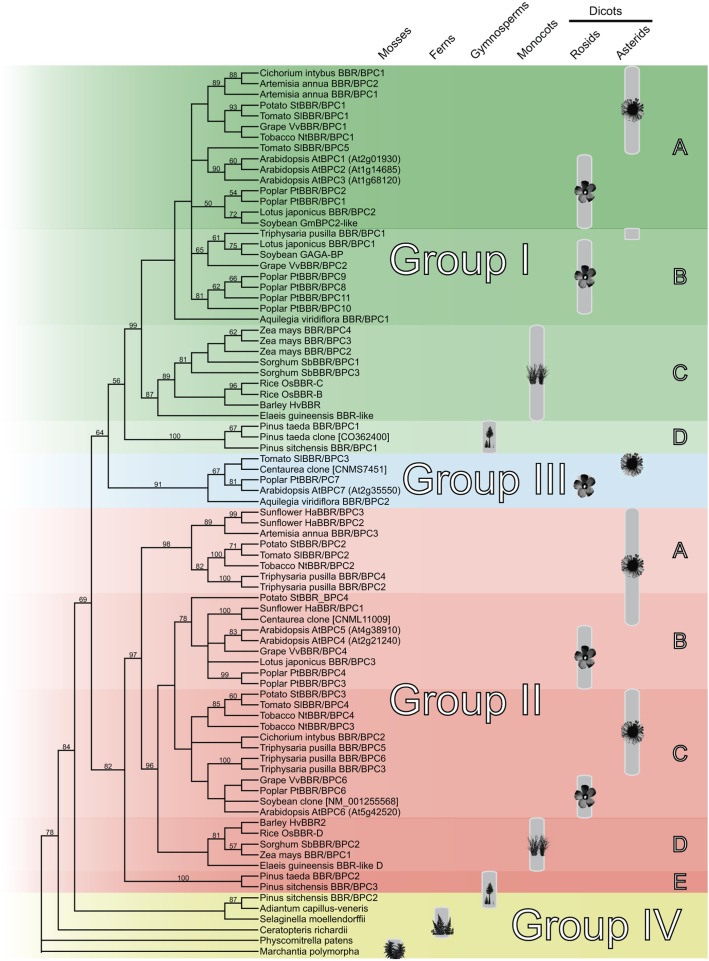
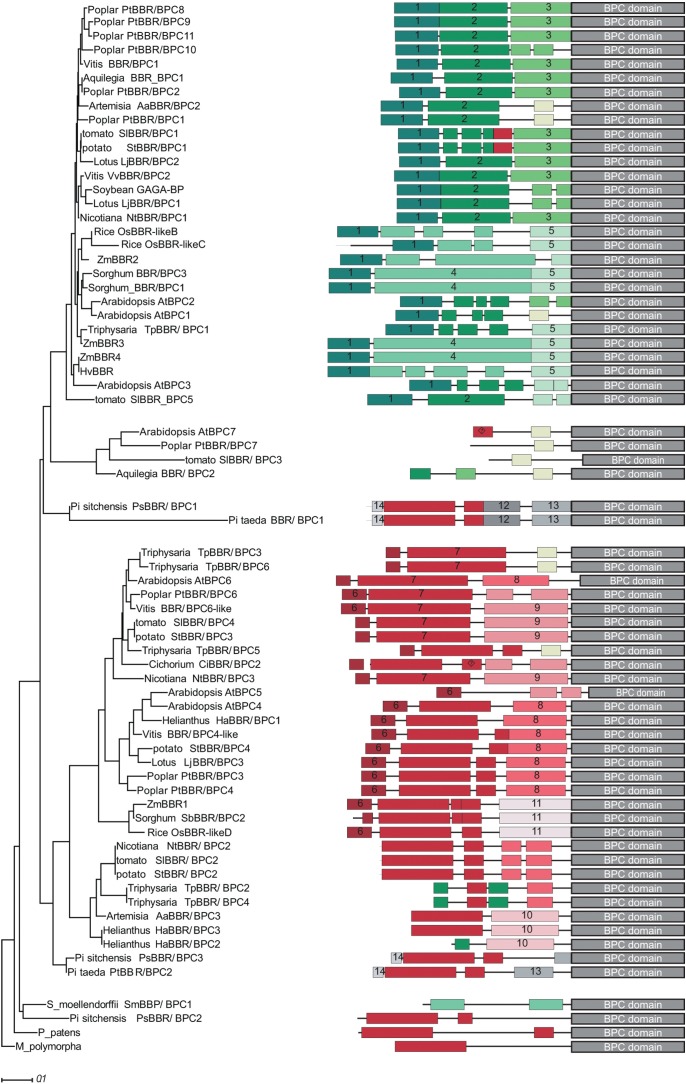
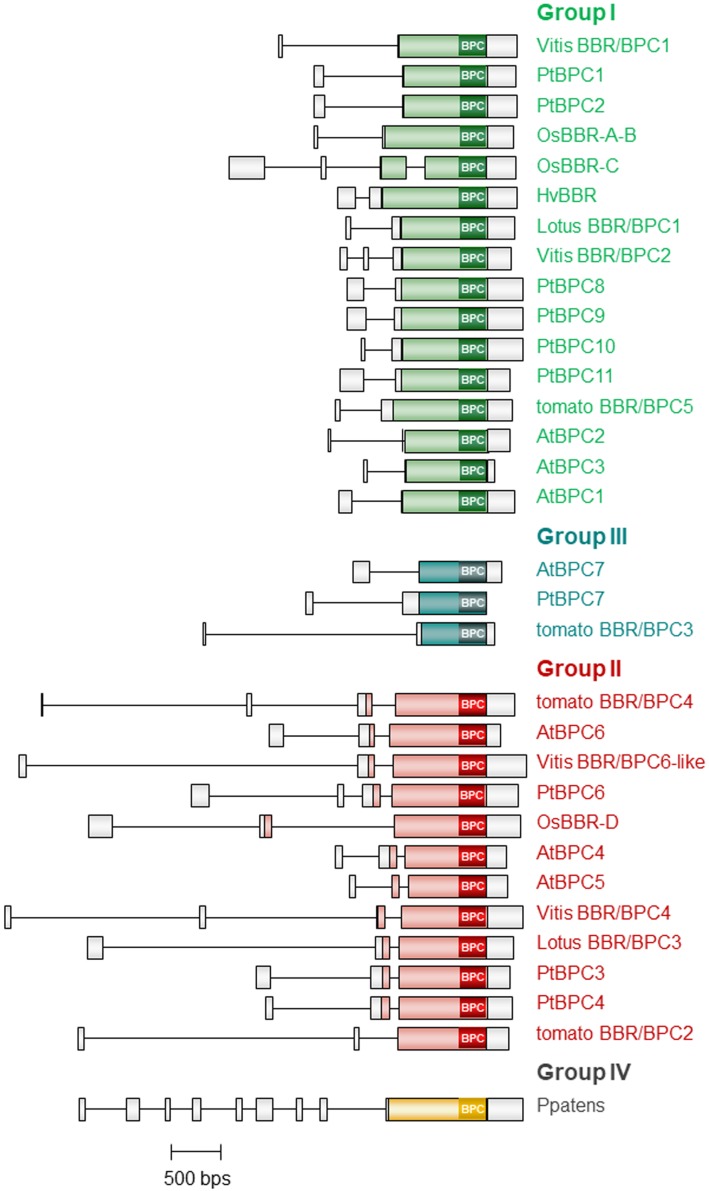
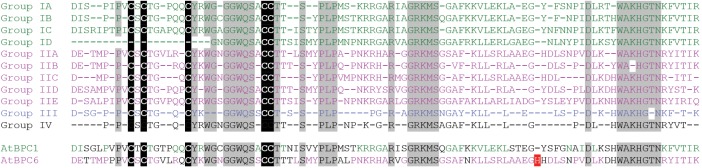
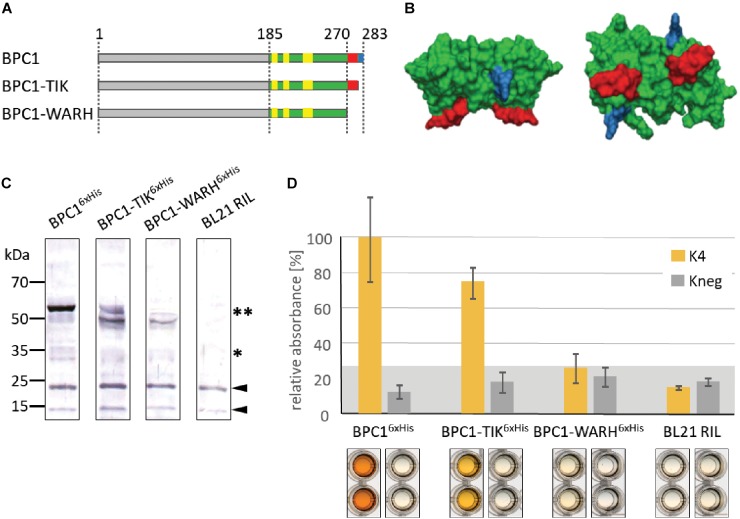
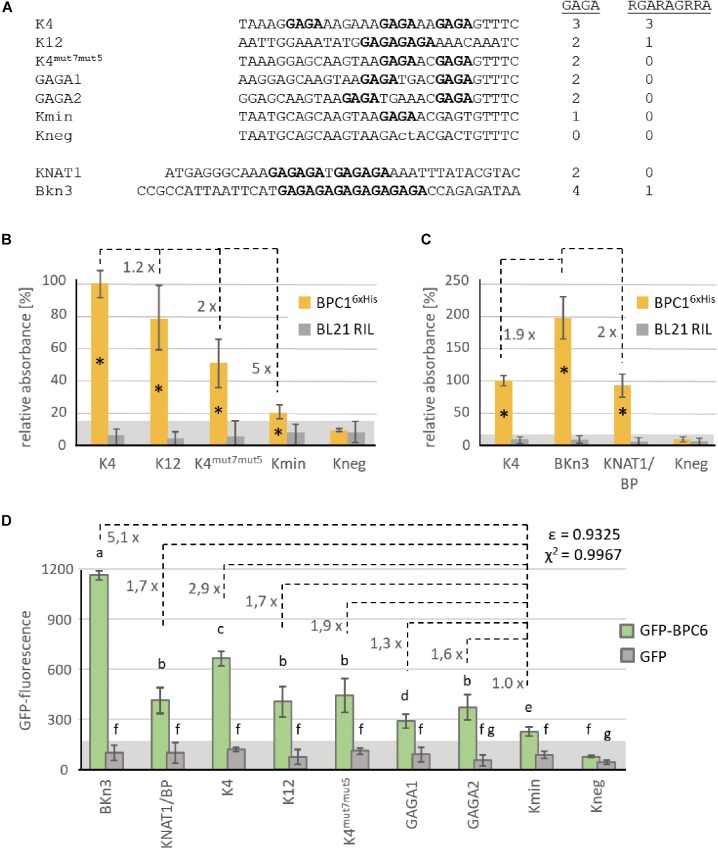
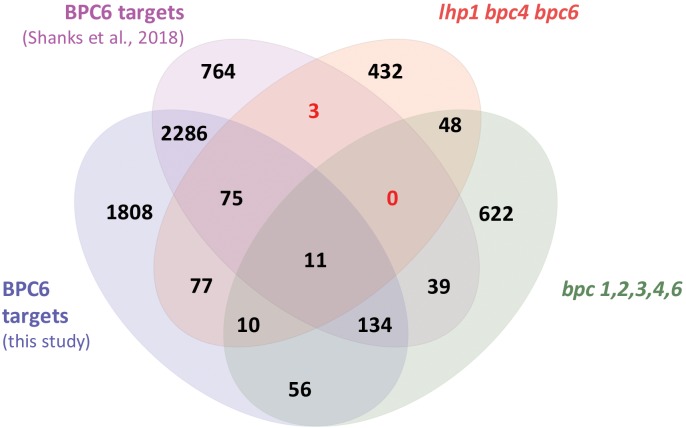
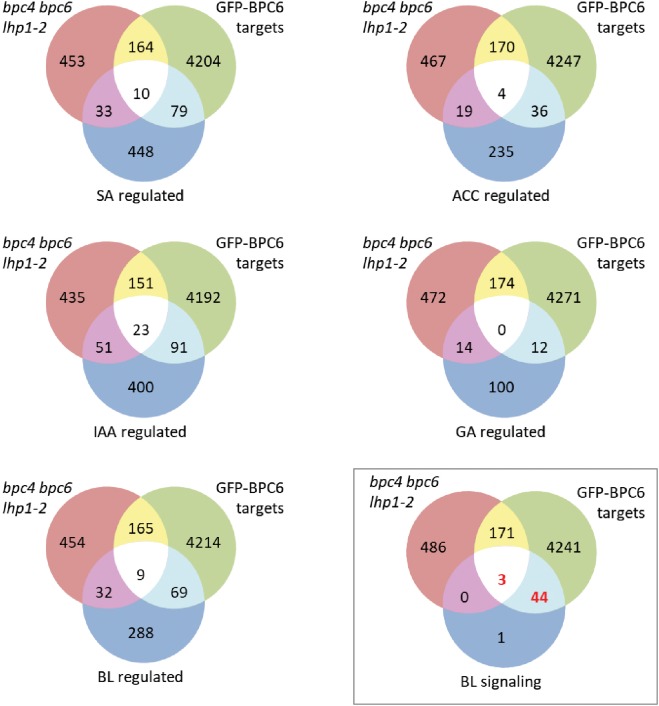
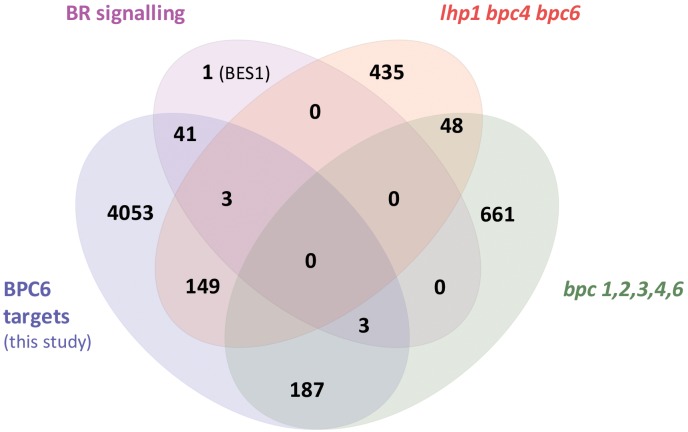
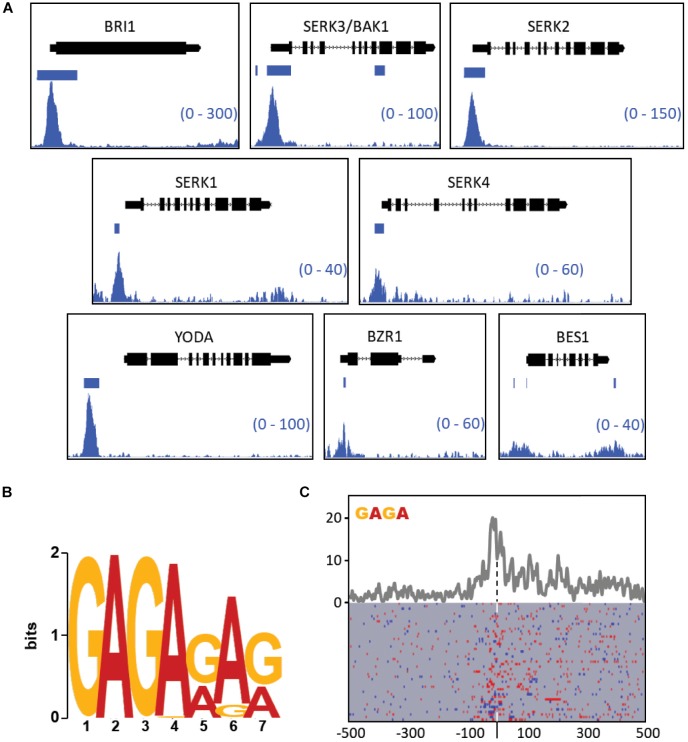
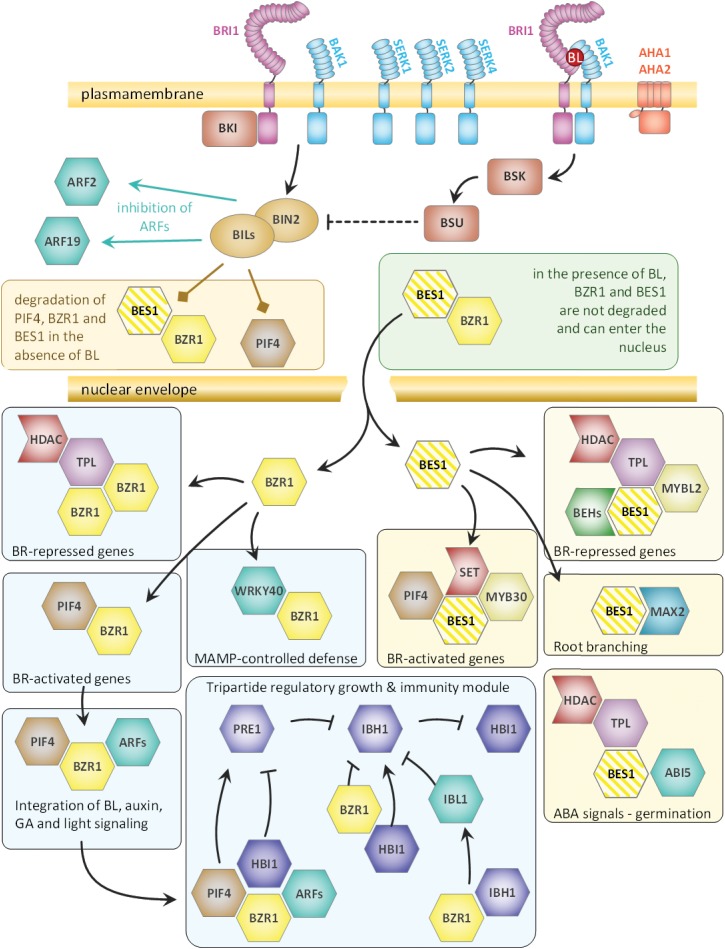
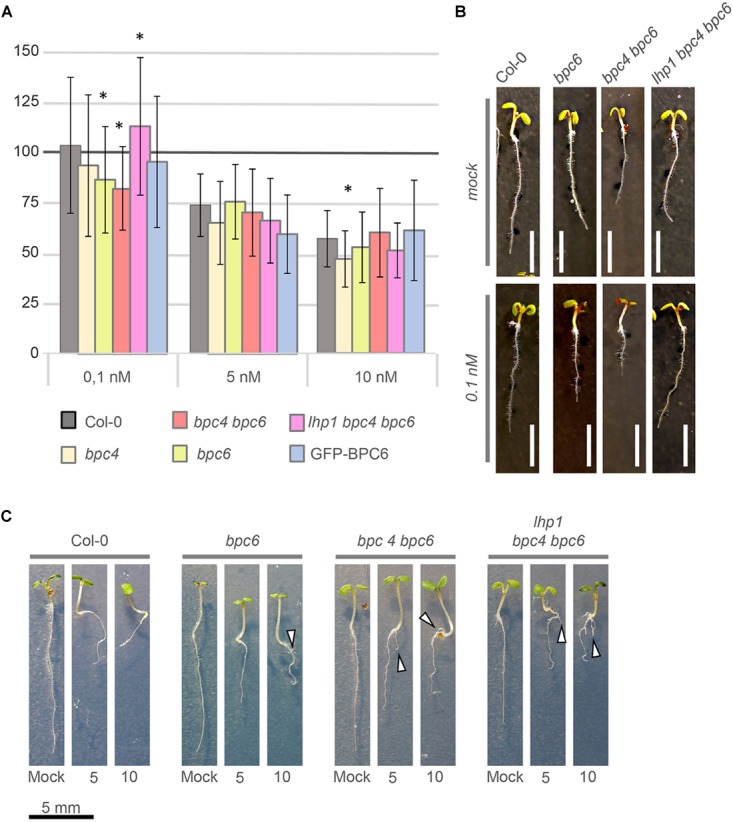
Plant GAGA-motif binding factors are encoded by the BARLEY B RECOMBINANT / BASIC PENTACYSTEINE (BBR/BPC) family, which fulfill indispensable functions in growth and development. BBR/BPC proteins control flower development, size of the stem cell niche and seed development through transcriptional regulation of homeotic transcription factor genes. They are responsible for the context dependent recruitment of Polycomb repressive complexes (PRC) or other repressive proteins to GAGA-motifs, which are contained in Polycomb repressive DNA-elements (PREs). Hallmark of the protein family is the highly conserved BPC domain, which is required for DNA binding. Here we study the evolution and diversification of the BBR/BPC family and its DNA-binding domain. Our analyses supports a further division of the family into four main groups (I-IV) and several subgroups, to resolve a strict monophyletic descent of the BPC domain. We prove a polyphyletic origin for group III proteins, which evolved from group I and II members through extensive loss of domains in the N-terminus. Conserved motif searches lend to the identification of a WAR/KHGTN consensus and a TIR/K motif at the very C-terminus of the BPC-domain. We could show by DPI-ELISA that this signature is required for DNA-binding in AtBPC1. Additional binding studies with AtBPC1, AtBPC6 and mutated oligonucleotides consolidated the binding to GAGA tetramers. To validate these findings, we used previously published ChIP-seq data from GFP-BPC6. We uncovered that many genes of the brassinosteroid signaling pathway are targeted by AtBPC6. Consistently, bpc6, bpc4 bpc6, and lhp1 bpc4 bpc4 mutants display brassinosteroid-dependent root growth phenotypes. Both, a function in brassinosteroid signaling and our phylogenetic data supports a link between BBR/BPC diversification in the land plant lineage and the complexity of flower and seed plant evolution.

Keywords: BBR/BPC proteins; GAGA-binding domain; GAGA-factors (GAF); PRE; Polycomb repressive complexes; basic Pentacysteine transcription factors.


Figures

FIGURE 1
FIGURE 1
Cladogram of the monophyletic Basic PentaCysteine (BPC) DNA-binding domain. Neighbor-Joining tree based on an alignment of 83 BPC domain protein sequences. The plant symbols indicate the distribution of the BPC proteins all over the vascular plants with maturing diversification in higher dicots. The tree topology was computed using phylogeny.fr with 1000 bootstrap replications and Jones-Taylor-Thornton matrix distances. Only bootstrap values above 50% are shown. Nodes with bootstrap values below 20% are collapsed.
FIGURE 2
FIGURE 2
Phylogram and conserved domain structures of full-length BBR/BPC proteins. The phylogram (left) and the corresponding protein domain structures (right) are based of 68 full-length BBR/BPC protein sequences. The phylogenetic tree was computed using phylogeny.fr (Dereeper et al., 2008) with 1000 bootstrap replications and Jones-Taylor-Thornton matrix distances. Only bootstrap values above 50% are shown. Nodes with bootstrap values below 20% are collapsed. Conserved domains were identified using MEME software suit tool collection. A motif overview is provided as Supplementary Data Sheet S1.
FIGURE 3
FIGURE 3
Intron- and Exon Structure of selected BBR/BPC genes. Schematic representation of exons (boxes) and introns (lines) in selected members of the BBR/BPC proteins. Coding regions of the different groups are color-coded.
FIGURE 4
FIGURE 4
High degree of conservation in the BPC domain. Protein sequence alignment of the Basic PentaCysteine (BPC) DNA-binding domain consensi, that were derived from protein sequences contained in Supplementary Data Sheet S1. Positions that are evolutionary retained in all BBR/BPC group members are highlighted by gray background The highly conserved Cysteines are emphasized by black background. The unique histidine residue that occurs only in Arabidopsis BPC6 is indicated in red.
FIGURE 5
FIGURE 5
Binding capacity of BPC1 mutants. (A) Schematic overview of all 6×His-epitope tagged BPC1 mutants and truncations. The highly conserved Cysteines are highlighted by yellow boxes. The position of the conserved WARHGTN signature is indicated (red); the final three amino acids consensus TIR is indicated in blue color. (B) Structural model of a putative BPC1 domain dimer to illustrate predicted positions for conserved amino acids. The conserved WARHGTN motif is highlighted in red color. The conserved TIR motif at the C-terminus is indicated in blue color. (C) Gel-blot experiments with immunological detection of all recombinant proteins. The expected molecular weights for monomer () and dimer (∗∗) proteins are indicated. (D) Specific binding of 6×His-epitope tagged BPC1 versions to positive (K4) and negative (Kneg) dsDNA-probes in DPI-ELISA experiments. The histogram bars show normalized signal intensities and error bars represent one standard deviation. Gray background shading indicates level of confidence for significant binding (t-test p < 0.05).
FIGURE 6
FIGURE 6
Comparative binding studies with BPC1 and BPC6. (A) DNA-sequences of the double stranded oligonucleotide probes. Only the biotinylated sense strand is given in 5′ to 3′-orientation. GAGA/TCTC tetranucleotides are highlighted in bold. The number of GAGA- or RGARAGRRA-motifs contained in each DNA-probe is indicated. (B,C) Specific binding of 6×His-epitope tagged BPC1 to the indicated double stranded oligonucleotide probes. Data of both histograms were derived from different experiments with different protein extracts. The histogram bars show normalized signal intensities that relate to the binding intensity with the K4 probe. The fold difference between the signal intensities of different bars are indicated at a dashed line. Error bars represent one standard deviation. Gray background shading indicates level of confidence for significant binding (t-test p < 0.05). (D) Specific binding of recombinant GFP-BPC6 to indicated DNA-probes in qDPI-ELISA experiments. Histogram bars are derived from data from different experiments with three different extracts and show raw GFP-fluorescence. Numbers at dashed lines indicate the fold difference between the fluorescence signals of different probes related to the Kmin probe, with only s single GAGA-motif. Error bars represent one standard deviation. Gray background shading indicates level of confidence for significant binding (t-test p < 0.05). The correlation between the number of GAGA-tetranucleotide motifs and the fold difference to Kmin is indicated as Pearson ε or as χ2.
FIGURE 7
FIGURE 7
Overlap between the two different BPC6 target gene lists and the transcriptome in bpc mutants. Venn diagram display of the BPC6 target genes from our analysis, the BPC6 target genes from a previous publication (Shanks et al., 2018) and the transcriptome of mutants that are impaired in BPC6 function. Significantly underrepresented overlap is indicated in red.
FIGURE 8
FIGURE 8
Comparison of our BPC6 target genes with selected phytohormone gene lists. Venn diagram comparison of the indicated gene lists with our BPC6 target gene list and the differentially expressed genes in the lhp1 bpc4 bpc6 mutant (Hecker et al., 2015). The gene lists are provided as Supplementary Table S7. The comparison with the 48 brassinosteroid signaling genes is highlighted by a box. Significantly enriched overlap is indicated in red.
FIGURE 9
FIGURE 9
Only six brassinosteroid signaling genes are differentially expressed in mutants plants. Overlap between our BPC6 target gene list, the 48 brassinosteroid signaling genes and the differentially expressed genes in lhp1 bpc4 bpc6 or in bpc1,2,3,4,6 mutant roots.
FIGURE 10
FIGURE 10
Visualization of GFP-BPC6 binding sites upstream of central genes involved in the brassinosteroid signaling. (A) BPC6 binding sites upstream of multiple genes involved in the brassinosteroid response are visualized by using the Integrative Genome Browser. The bedgraphs for GFP-BPC6 ChIP binding sites are shown as two merged biological replicates. Regions of more than 5-fold enrichment over the GFP control is indicated a horizontal bar. The gene models are shown above each panel, with boxes corresponding to exons and lines to introns, with the direction of transcription indicated by small arrows. The shown data range for each investigated gene is shown in the bottom right corner. (B) Identification of most highly enriched sequence logo in the promotor of the 48 brassinosteroid signaling genes. (C) Motif density map (top) and distribution map (bottom) of the tetranucleotide GAGA (blue) or TCTC (red) in the brassinosteroid signaling genes. The maps are centered (dashed line) at the highest peak in the bedgraph data Supplementary Table S8. A detailed map is provided as Supplementary Data Sheet S4.
FIGURE 11
FIGURE 11
Schematic overview of the brassinosteroid pathway components that are targeted by BPC6 in vivo. The composition of the overview is derived from previous publications (Witthoft and Harter, 2011; Belkhadir and Jaillais, 2015; Ladwig et al., 2015). All genes of the brassinosteroid signaling component, except for BES1, are targeted by BPC6 with high confidence. As BPC6 binding to BES1 is only weak, it is colored with stripes.
FIGURE 12
FIGURE 12
Brassinosteroid sensitivity assay with bpc- mutant plants. (A) Relative root-growth of 6-day-old seedlings treated with 0.1, 5, or 10 nM brassinolide. Control and treated media were supplemented with 5 nM DMSO. For visualization, total root-length was calculated relative to the control for each genotype. The histogram bars show relative root length normalized to the wildtype Col-0 control (100%). Error bars represent standard deviation. White scale bar represents 4 mm. (B) Representative phenotype of selected individuals that showed a significant difference in relative root length at 0.1 nM brassinolide. (C) Side root initiation (arrow head) in 8-day-old plants on media supplemented with 5 nM or 10 nM brassinolide. Scale bar for all seedlings is given below the display.

Similar articles

Cited by

References

    1. Adkins N. L., Hagerman T. A., Georgel P. (2006). GAGA protein: a multi-faceted transcription factor. Biochem. Cell Biol. 84 559–567. 10.1139/o06-062 - DOI - PubMed
    1. Adrian J., Torti S., Turck F. (2009). From decision to commitment: the molecular memory of flowering. Mol. Plant 2 628–642. 10.1093/mp/ssp031 - DOI - PubMed
    1. Bailey T. L., Boden M., Buske F. A., Frith M., Grant C. E., Clementi L., et al. (2009). MEME SUITE: tools for motif discovery and searching. Nucleic Acids Res. 37 W202–W208. 10.1093/nar/gkp335 - DOI - PMC - PubMed
    1. Belkhadir Y., Jaillais Y. (2015). The molecular circuitry of brassinosteroid signaling. New Phytol. 206 522–540. 10.1111/nph.13269 - DOI - PubMed
    1. Berendzen K. W., Stuber K., Harter K., Wanke D. (2006). Cis-motifs upstream of the transcription and translation initiation sites are effectively revealed by their positional disequilibrium in eukaryote genomes using frequency distribution curves. BMC Bioinformatics 7:522. 10.1186/1471-2105-7-522 - DOI - PMC - PubMed

LinkOut - more resources