. 2019 Apr 1:2019:7584685.
doi: 10.1155/2019/7584685. eCollection 2019.

Morphological Characteristics of the Thymus and Spleen and the Subpopulation Composition of Lymphocytes in Peripheral Blood during Systemic Inflammatory Response in Male Rats with Different Resistance to Hypoxia

Affiliations

Morphological Characteristics of the Thymus and Spleen and the Subpopulation Composition of Lymphocytes in Peripheral Blood during Systemic Inflammatory Response in Male Rats with Different Resistance to Hypoxia

Dzhuliia Sh Dzhalilova et al. Int J Inflam. .

Abstract

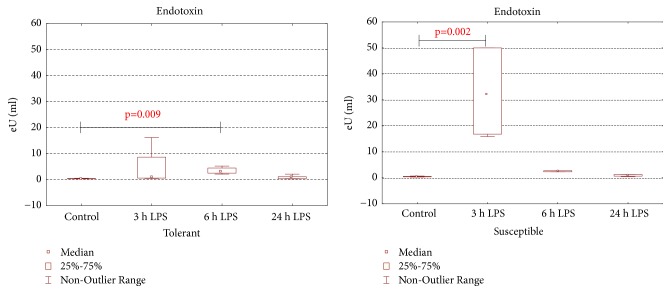
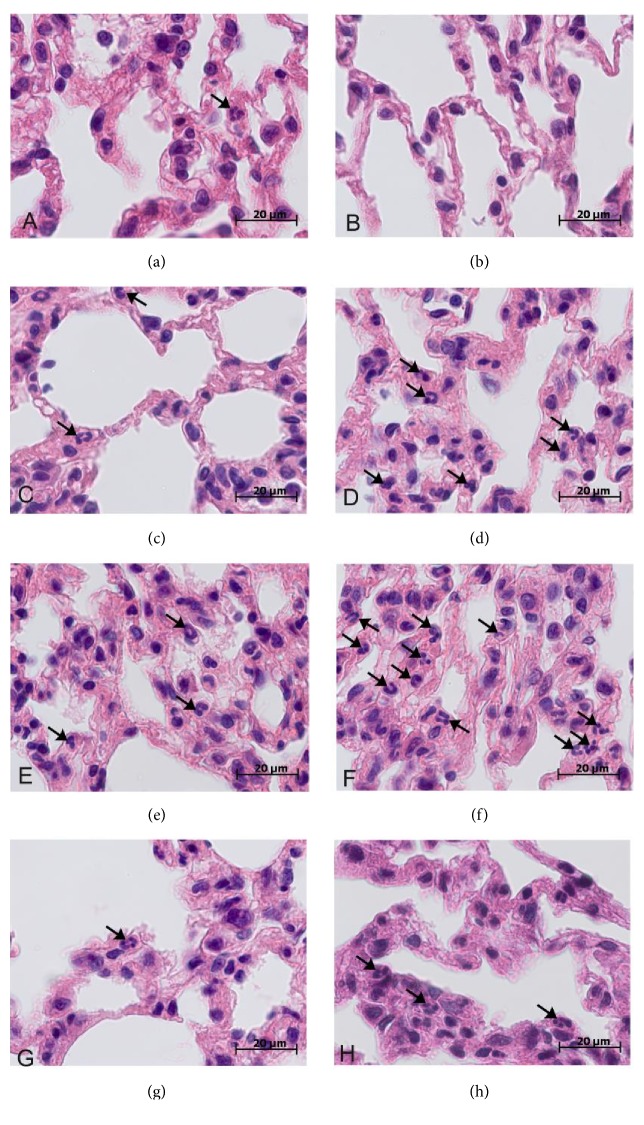
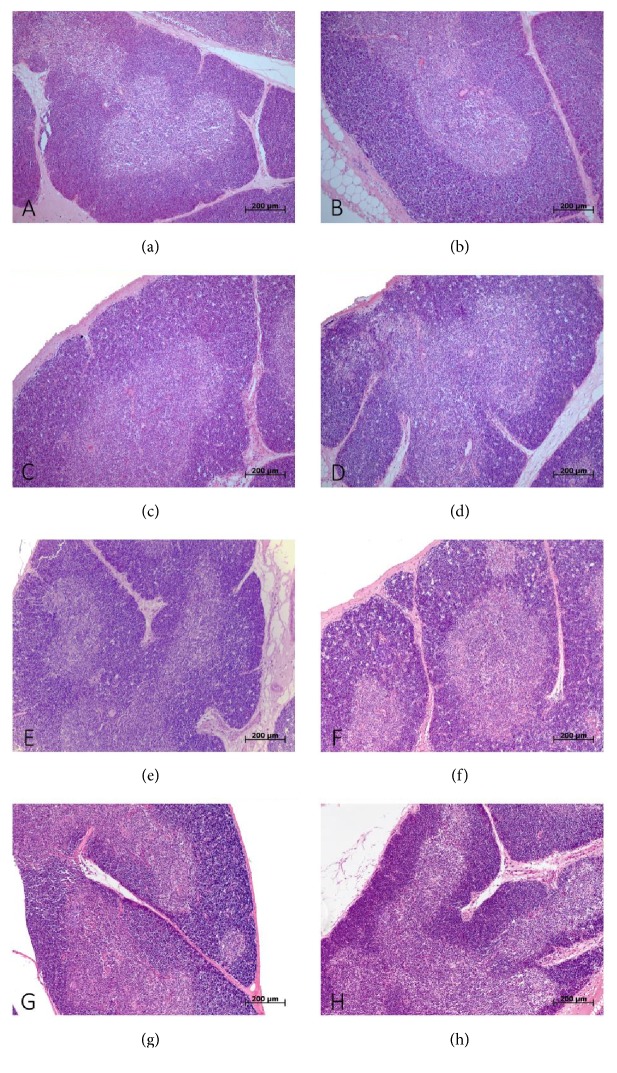
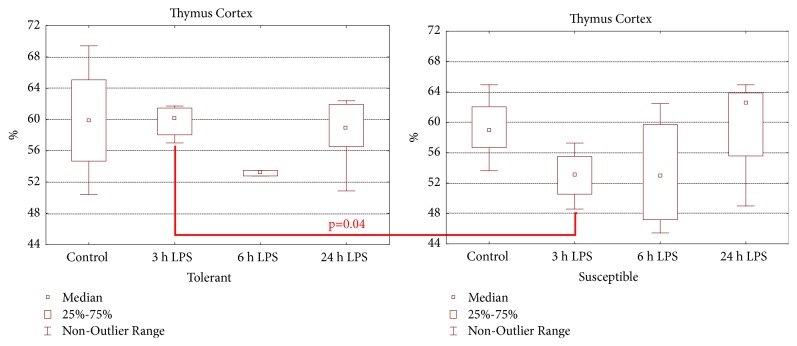
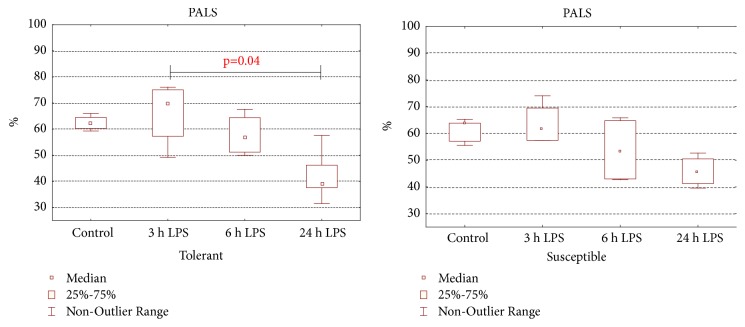
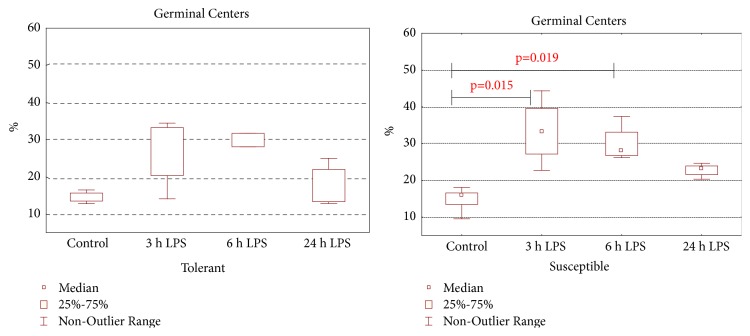
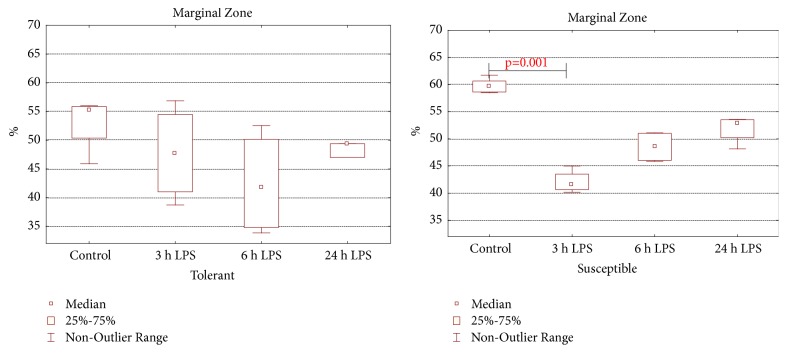
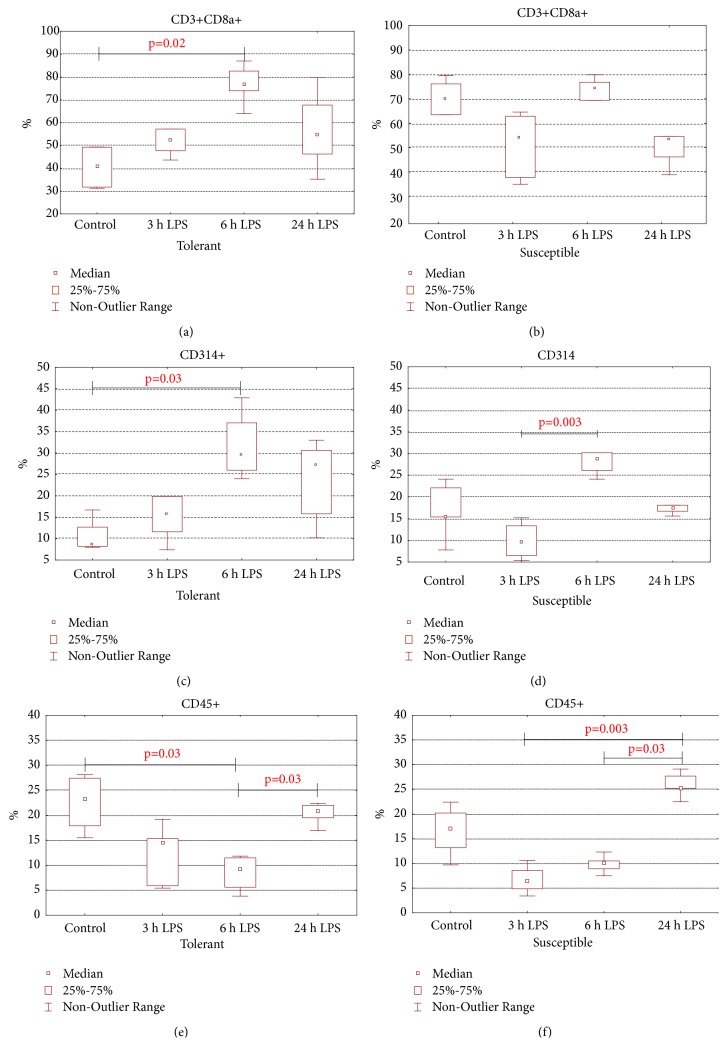
On the model of the systemic inflammatory response (SIRS), induced by lipopolysaccharide (LPS), the morphological and functional changes in the thymus and spleen and the subpopulation composition of peripheral blood lymphocytes of rats differing in resistance to hypoxia were studied. It was demonstrated that the level of endotoxin in blood serum after 3 hours of LPS administration in susceptible-to-hypoxia rats was 64 times higher than in the control group, while in tolerant-to-hypoxia animals it was only 8 times higher in 6 hours. After 24 hours of LPS injection, only in susceptible-to-hypoxia rats did the level of C-reactive protein in blood serum increase. There is a difference in the dynamics of morphological changes of lymphoid organs after LPS injection in tolerant- and susceptible-to-hypoxia animals. After 3 hours of LPS administration, the tolerant-to-hypoxia rats showed no changes in the thymus, spleen, and subpopulation composition of lymphocytes in peripheral blood. After 6 hours there was only a decrease in B-lymphocytes and increase in cytotoxic T-lymphocytes and NK cells. After 1 day of LPS injection, the tolerant-to-hypoxia rats had devastation in PALS of the spleen. After 3 hours of LPS injection the susceptible-to-hypoxia animals had reactive changes in the lymphoid organs: decrease of the thymus cortex, narrowing of the marginal zones of spleen lymphoid follicles, widening of their germinal centers, and a decrease in the absolute number of cytotoxic T-lymphocytes, NK cells, and B-lymphocytes. After 24 hours of LPS injection the tolerant-to-hypoxia animals had a greater absolute number of T-lymphocytes and NK cells in comparison with the susceptible rats. Thus, in animals with different resistance to hypoxia the LPS-induced SIRS is characterized by different dynamics of morphological and functional changes of the thymus and spleen. The obtained data will serve as a basis for the development of new individual approaches to the prevention and treatment of infectious and inflammatory diseases.


Figures

Figure 1
Figure 1
Endotoxin serum levels in tolerant- and susceptible-to-hypoxia rats after 3, 6, and 24 hours of LPS administration. Data are presented as median (25%, 75%); the statistical significance of differences (p) is determined by the Kruskal-Wallis method (n = 5 in each group).
Figure 2
Figure 2
Morphological changes in the lungs of tolerant- and susceptible-to-hypoxia male Wistar rats after 3, 6, and 24 hours of LPS administration. Hematoxylin and eosin staining. Original magnification: ((a)-(h)) 1000x. Neutrophils are marked via arrows. (a) Tolerant-to-hypoxia rat, control group; few neutrophils in the field of view. (b) Susceptible-to-hypoxia rat, control group; thin interalveolar septa without neutrophils in the field of view. (c) Tolerant-to-hypoxia rat, 3 h LPS; interalveolar septa with neutrophils. (d) Susceptible-to-hypoxia rat, 3 h LPS; pronounced neutrophil infiltration in thickened interalveolar septa. (e) Tolerant-to-hypoxia rat, 6 h LPS; mild neutrophil infiltration in thickened interalveolar septa. (f) Susceptible-to-hypoxia rat, 6 h LPS; high number of neutrophils in thickened interalveolar septa. (g) Tolerant-to-hypoxia rat, 24 h LPS; interalveolar septa with few neutrophils. (h) Susceptible-to-hypoxia rat, 24 h LPS; interalveolar septa with neutrophils.
Figure 3
Figure 3
Morphological changes in the thymus of tolerant- and susceptible-to-hypoxia male Wistar rats after 3, 6, and 24 hours of LPS administration. Hematoxylin and eosin staining. Original magnification: 100x. (a) Tolerant-to-hypoxia rat, control group; cortex is wide, and the border between the cortex and medulla is readable. (b) Susceptible-to-hypoxia rat, control group; the proportion of the cortex/medulla is 1:1, and the border between them is readable. (c) Tolerant-to-hypoxia rats, 3 h LPS; narrowing of cortex (with a starry-sky aspect). (d) Susceptible-to-hypoxia rats, 3 h LPS; mild involution, narrowing of cortex, more pronounced compared with tolerant ones. (e) Tolerant-to-hypoxia rats, 6 h LPS; mild involution; the cortex is narrow. (f) Susceptible-to-hypoxia rats, 6 h LPS; a pronounced starry-sky aspect, devastation of cortex, and macrophages and dying lymphocytes. (g) Tolerant-to-hypoxia rats, 24 h LPS; narrow cortex; the border between the cortex and medulla is readable. (h) Susceptible-to-hypoxia rats, 24 h LPS; narrow cortex; the border between the cortex and medulla is readable.
Figure 4
Figure 4
The volume fraction of the thymus cortex in tolerant- and susceptible-to-hypoxia rats after 3, 6, and 24 hours of LPS administration. Data are presented as median (25%, 75%); the statistical significance of differences (p) between tolerant and susceptible rats is determined by the Mann-Whitney U test and between different time points after LPS injection by the Kruskal-Wallis method (n = 5 in each group).
Figure 5
Figure 5
The volume fraction of the spleen PALS in tolerant- and susceptible-to-hypoxia rats after 3, 6, and 24 hours of LPS administration. Data are presented as median (25%, 75%); the statistical significance of differences (p) is determined by the Kruskal-Wallis method (n = 5 in each group).
Figure 6
Figure 6
The volume fraction of germinal centers of spleen lymphoid follicles in tolerant- and susceptible-to-hypoxia rats after 3, 6, and 24 hours of LPS administration. Data are presented as median (25%, 75%); the statistical significance of differences (p) is determined by the Kruskal-Wallis method (n = 5 in each group).
Figure 7
Figure 7
The volume fraction of the marginal zone of spleen lymphoid follicles in tolerant- and susceptible-to-hypoxia rats after 3, 6, and 24 hours of LPS administration. Data are presented as median (25%, 75%); the statistical significance of differences (p) is determined by the Kruskal-Wallis method (n = 5 in each group).
Figure 8
Figure 8
The relative number of ((a), (b)) cytotoxic T-lymphocytes (CD3+CD8a+), ((c), (d)) NK cells (CD314+), and ((e), (f)) B-lymphocytes (CD45+) in peripheral blood of tolerant- (a, c, and e) and susceptible- (b, d, and f) to-hypoxia rats after 3, 6, and 24 hours of LPS administration. Data are presented as median (25%, 75%); the statistical significance of differences (p) is determined by the Kruskal-Wallis method (n = 5 in each group).

Similar articles

Cited by

References

    1. Martin G. S., Mannino D. M., Eaton S., Moss M. The epidemiology of sepsis in the United States from 1979 through 2000. The New England Journal of Medicine. 2003;348(16):1546–1554. doi: 10.1056/NEJMoa022139. - DOI - PubMed
    1. Esper A. M., Moss M., Lewis C. A., Nisbet R., Mannino D. M., Martin G. S. The role of infection and comorbidity: factors that influence disparities in sepsis. Critical Care Medicine. 2006;34(10):2576–2582. doi: 10.1097/01.CCM.0000239114.50519.0E. - DOI - PMC - PubMed
    1. Mayr F. B., Yende S., Angus D. C. Epidemiology of severe sepsis. Virulence. 2014;5(1):4–11. doi: 10.4161/viru.26803. - DOI - PMC - PubMed
    1. Ghosh D., Kumar R., Pal K. Individual variation in response to simulated hypoxic stress of rats. Indian Journal of Experimental Biology. 2012;50:744–748. - PubMed
    1. Kirova Y. I., Germanova E. L., Lukyanova L. D. Phenotypic features of the dynamics of HIF-1α levels in rat neocortex in different hypoxia regimens. Bulletin of Experimental Biology and Medicine. 2013;154(6):718–722. doi: 10.1007/s10517-013-2038-z. - DOI - PubMed