. 2017 Aug 14:3:17028.
doi: 10.1038/micronano.2017.28. eCollection 2017.

Organic transistor platform with integrated microfluidics for in-line multi-parametric in vitro cell monitoring

Affiliations

Organic transistor platform with integrated microfluidics for in-line multi-parametric in vitro cell monitoring

Vincenzo F Curto et al. Microsyst Nanoeng. .

Abstract

Future drug discovery and toxicology testing could benefit significantly from more predictive and multi-parametric readouts from in vitro models. Despite the recent advances in the field of microfluidics, and more recently organ-on-a-chip technology, there is still a high demand for real-time monitoring systems that can be readily embedded with microfluidics. In addition, multi-parametric monitoring is essential to improve the predictive quality of the data used to inform clinical studies that follow. Here we present a microfluidic platform integrated with in-line electronic sensors based on the organic electrochemical transistor. Our goals are two-fold, first to generate a platform to host cells in a more physiologically relevant environment (using physiologically relevant fluid shear stress (FSS)) and second to show efficient integration of multiple different methods for assessing cell morphology, differentiation, and integrity. These include optical imaging, impedance monitoring, metabolite sensing, and a wound-healing assay. We illustrate the versatility of this multi-parametric monitoring in giving us increased confidence to validate the improved differentiation of cells toward a physiological profile under FSS, thus yielding more accurate data when used to assess the effect of drugs or toxins. Overall, this platform will enable high-content screening for in vitro drug discovery and toxicology testing and bridges the existing gap in the integration of in-line sensors in microfluidic devices.

Keywords: bioelectronics; in vitro; in-line sensors; microfluidics.


Conflict of interest statement

The authors declare no conflict of interest.

Figures

Figure 1
Figure 1
The integration of microfluidics with the OECT for combined optical and electronic monitoring. (a) Graphical representation of the developed platform integrating the OECT with microfluidics. Top right, an illustration of the OECTs and the cell layer lining the bottom surface of the microfluidic channel. Bottom right, top and cross-sectional views of the microfluidic device. (b) A picture of a fully assembled microfluidic platform located on a microscope stage, featuring inlet and outlet ports and tubing. The red silicone blocks are used to guarantee stable connections between the inlet and outlet tubing and the microfluidic platform. (c) Fluorescence image of a fully confluent layer of MDCK II cells transfected with pLifeAct (red fluorescent protein-labeled F-actin) grown inside the microfluidic channel integrated with a planar OECT. The black blocks are the source and drain gold transistor channel contact lines (scale bar, 100 μm). OECT, organic electrochemical transistor; MDCK II, Madin-Darby canine kidney cells from the distal tube of the nephron.
Figure 2
Figure 2
Illustration of the effect of FSS on F-actin expression via time-lapse imaging of cells grown on the platform. (a) The variation in the actin expression is shown as the relative increase in the fluorescence intensity (λ=584 nm) induced by physiologically relevant fluid shear stress (FSS). A confluent layer of epithelial cells (MDCK II-pLifeAct) are grown to confluency under dynamic conditions with a flow rate equal to 1.67 μL min−1, until cells show a typical cobblestone-like morphology. Once the epithelium is fully confluent, a greater flow rate of 20 μL min−1 is applied, resulting in an FSS of 0.3 dyne cm−2, for a total of 15 h of mechanical stimulation of the cells. Below, the FSS/flow rate profile used for the experiment is represented. (b) Fluorescence images of MDCK II epithelium captured at different time (hh:mm) points, before (00:30), during (05:00, 10:00, and 15:00) and after (20:00) application of a flow rate equal to 20 μL min−1 (scale bar, 100 μm). (c) F-actin confocal images of the apical side (i, iii) and perijunctional section (ii, iv)of a confluent cell layer captured 15 h after exposition at flow rates of 1.67 μL min−1 (i, ii) or 20 μL min−1 (iii, iv), the latter corresponding to 0.3 dyne cm−2 FSS. On the right, cell heights measured by confocal microscopy in z-sectioned images showing an increase of the cell height due to the FSS (scale bar, 10 μm).
Figure 3
Figure 3
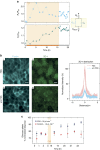
Multi-parametric readout of epithelial cell response to FSS. (a) Typical in-line monitoring of the cell layer resistance (Rcl) and capacitance (Ccl) before, during, and after FSS stimulation with a shear stress equal to 0.3 dyne cm−2. The cell layer resistance and capacitance was measured every 90 min during the 15 h of constant FSS (orange area on time axis) and every 20 min for 6 h after FSS stimulation (gray area time axis). The inset equivalent circuits highlight the two electrical circuit elements, Rcl and Ccl, extracted from the fitting of the equivalent circuit model. From the equivalent circuit, Rs is the series resistance of the electrolyte and COECT the transistor capacitance (b) F-actin and ZO-1 fluorescence images of a confluent cell layer in the presence and absence of FSS stimulation (scale bar, 10 μm). On the right, the fluorescence intensity distribution of ZO-1 tight junction protein with and without FSS is shown (n=10). (c) Uptake of glucose by the MDCK II cell layer before and after FSS. An increase in the uptake of glucose was observed for cells stimulated with a physiologically relevant shear stress (20 μL min−1), while the glucose uptake remains unchanged in the control condition (1.6 μL min−1). A sample was collected every 1 h from the microfluidic outlet and glucose content was determined using an OECT-based glucose biosensor (n=3). Error bars show standard deviation from the mean of three different samples.
Figure 4
Figure 4
A microfluidic electrical wound-healing assay with the OECT. (a) Schematic of the experimental set-up of the developed OECT-based electrical wound-healing assay. A confluent cell layer covering the transistor channel area is electroporated with an oxidative square voltage, typically below 3 V (bottom schematic), resulting in an electrical wound of the same dimension as the transistor channel. The semicircle lines represent the electric field distribution at the electrode/electrolyte interfaces across the cell layer, while the two gray cells covering the transistor channel represent the electrically wounded cells. (b) The impact on the OECT maximum transconductance (gm=ΔIDVG) caused by the application of oxidative potentials for duty cycles (see equation) equal to 0.3 (green), 0.4 (red), and 0.5 (blue), n=3. (c) Typical time evolution of the OECT frequency-dependent response during the healing process of an electrical wound generated on a confluent cell layer of MDCK II-pLifeAct. A confluent layer of cells grown on the transistor channel induces a shift in the OECT cutoff frequency, from ~1400 Hz (dashed gray line) to ~30 Hz (solid black line). Following the generation of the electrical wound (2.7 V at 40 kHz, duty cycle 0.3, cycle time 30 s), the cutoff frequency increases (orange line) due to loss of cells from the active area of the device. As the healing of the cells progresses, a continuous decrease in the cutoff frequency is monitored until completion (blue line). Inset graph shows the sigmoidal evolution in the cutoff frequency during the healing process. The data point at time zero is omitted for clarity. Below are shown brightfield and fluorescence images for the pre-wound (black frame), wounded (orange frame), and healed (blue frame) cell layer (scale bar, 50 μm). (d) Electrical wound-healing assay performed inside the microfluidic device. On the top, the temporal evolution of the Rcl during the healing process is shown. The bottom panel contains the brightfield and the F-actin fluorescence images at different time during the healing process. In the brightfield images, the red arrows highlight the densely packed healing fronts incorporating the wounded cells and likely leading to the final increase of ~1.5-fold in the effective Rcl.(scale bar, 50 μm).
Figure 5
Figure 5
(a) Variation of the cell layer resistance of MDCK II-pLifeAct when exposed to cell culture media containing 2 μg mL−1 of cytochalasin D (Cyt D). A large drop in the cell-barrier resistance is visible within the first 10 min upon exposure of the cells to Cyt D. When fresh media (Cyt D free) was re-perfused inside the microchannel, a recovery of cell layer resistance was observed. On the right, the fluorescence images of the cells (b) before (gray frame), (c) during (green frame), and (d) after (purple frame) exposure to Cyt D are shown (scale bar, 20 μm). On the far right of the three frames zoom-in fluorescence and brightfield images of the central area of the transistor channel covered with the confluent cell layer (scale bar, 10 μm) are shown.

References

    1. Hartung T. Food for thought look back in anger–What clinical studies tell us about preclinical work. Altex 2013; 30: 275–291. - PMC - PubMed
    1. Avior Y, Sagi I, Benvenisty N. Pluripotent stem cells in disease modelling and drug discovery. Nature Review Molecular Cell Biology 2016; 17: 170–182. - PubMed
    1. McKim JM. Building a tiered approach to in vitro predictive toxicity screening: A focus on assays with in vivo relevance. Combinatorial Chemistry & High Throughput Screening 2010; 13: 188–206. - PMC - PubMed
    1. Breslin S, O’Driscoll L. Three-dimensional cell culture: The missing link in drug discovery. Drug Discovery Today 2013; 18: 240–249. - PubMed
    1. Elliott NT, Yuan F. A review of three-dimensional in vitro tissue models for drug discovery and transport studies. Journal of Pharmaceutical Sciences 2011; 100: 59–74. - PubMed