. 2018 Dec 3:4:37.
doi: 10.1038/s41378-018-0038-x. eCollection 2018.

Magnetic field sensors using arrays of electrospun magnetoelectric Janus nanowires

Affiliations

Magnetic field sensors using arrays of electrospun magnetoelectric Janus nanowires

Matthew J Bauer et al. Microsyst Nanoeng. .

Abstract

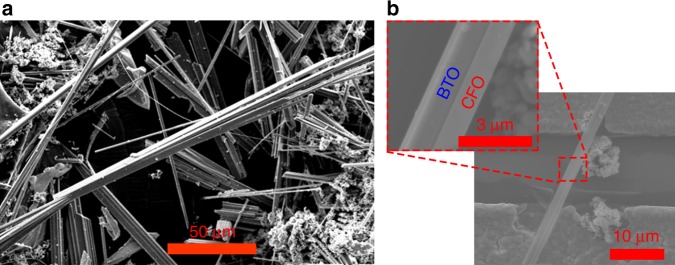
The fabrication and characterization of the first magnetoelectric sensors utilizing arrays of Janus magnetoelectric composite nanowires composed of barium titanate and cobalt ferrite are presented. By utilizing magnetoelectric nanowires suspended across electrodes above the substrate, substrate clamping is reduced when compared to layered thin-film architectures; this results in enhanced magnetoelectric coupling. Janus magnetoelectric nanowires are fabricated by sol-gel electrospinning, and their length is controlled through the electrospinning and calcination conditions. Using a directed nanomanufacturing approach, the nanowires are then assembled onto pre-patterned metal electrodes on a silicon substrate using dielectrophoresis. Using this process, functional magnetic field sensors are formed by connecting many nanowires in parallel. The observed magnetic field sensitivity from the parallel array of nanowires is 0.514 ± .027 mV Oe-1 at 1 kHz, which translates to a magnetoelectric coefficient of 514 ± 27 mV cm-1 Oe-1.


Conflict of interest statement

The authors declare no conflict of interest.

Figures

Fig. 1
Fig. 1
A device schematic showing magnetoelectric barium titanate–cobalt ferrite nanowires assembled in parallel across metal electrodes
Fig. 2
Fig. 2
a Scanning electron micrograph of Janus barium titanate - cobalt ferrite (BTO–CFO) nanowires post salt calcination. These nanowires were electrospun at 2 kV cm−1 and calcined for 8 h at 1100 °C with a ramp rate of 10 °C min−1. b Scanning electron micrograph of a single Janus BTO–CFO nanowire post assembly across the nanowire arrays, the two phases of the Janus nanowire are labelled here as BTO and CFO solely for illustrative purposes as in the micrograph it is uncertain which section of the nanowire corresponds to each phase
Fig. 3
Fig. 3
a Histogram and fitted lognormal distributions for nanowires calcined at 25 and 10 °C min−1 with an electrospinning voltage of 2 kV cm−1 showing a decreasing nanowire length with increasing calcination temperature. b Histogram and fitted lognormal distributions for nanowires electrospun at 2 and 1.83 kV cm−1 with a constant calcination ramp rate of 10 °C min−1 showing an increasing nanowire length with decreasing electrospinning voltage. c Nanowire lengths and voltages from nanowires electrospun at 2 and 1.83 kV cm−1 with a constant calcination ramp rate of 10 °C min−1 showing a positive correlation between nanowire diameter and length
Fig. 4
Fig. 4
X-ray diffraction spectra of the Janus nanowires post calcination showing peaks indicative of tetragonal barium titanate and spinel cobalt ferrite
Fig. 5
Fig. 5. Raman spectra of single phase barium titanate nanowires used to test whether barium carbonate (BCO) can be successfully removed with a dilute hydrochloric acid (HCl) wash.
Absence of the barium carbonate peaks in the as HCl treated sampled demonstrates that this wash was successful in removing BCO impurities
Fig. 6
Fig. 6
Successful assembly of barium titanate nanofibers in water, post barium carbonate removal with a dilute HCl wash and suspension using citric acid and adjusting the pH to around 9, at 5 kHz and 20 Vpp
Fig. 7
Fig. 7
Assembly of Janus nanofibers in a ethanol, b 2-methoxyethanol, and c butanol at 5 kHz and 20 Vpp. While positive dielectrophoresis was observed with all three solvents, ethanol evaporated quickly leaving less time for assembly and butanol appeared to produce slightly better assembly than 2-methoxyethanol
Fig. 8
Fig. 8
Assembly of Janus nanowires in butanol at 5 kHz and 42 Vpp in the test array with a linear density of 19 NWs mm−1
Fig. 9
Fig. 9
Formation of upper electrical contacts across the nanowires via a patterning of Ti/Cu electrode patterns via sputtering and lift-off; followed by spin coating blanket layer of LOR resist; and  assembly of nanowires; b spin coating and patterning AZ1512 photoresist to expose ends of the nanowires; c electroplating copper to make electrical contacts with nanowire; and d stripping of the remaining photoresist
Fig. 10
Fig. 10
Mass magnetization curve indicating ferrimagnetism in the cobalt ferrite phase of unassembled Janus nanowires from the same batch as those used to fabricate the nanowire array
Fig. 11
Fig. 11
Capacitance–voltage (C–V) measurement from the Janus nanowire array demonstrating ferroelectricity in the barium titanate phase. The test signal level was set to 100 mV at 750 kHz
Fig. 12
Fig. 12
Plot of the magnetoelectric coefficients of a row in the Janus nanowire array measured using the lock-in technique as a function of magnetic bias field at 200, 500, and 1000 Hz
Fig. 13
Fig. 13
a Effect of angle of the Janus nanowire array angle on the observed voltage generated by the array with a 4.9 Oe applied AC field at 1 kHz, as well as the fitted sine function used to find the angle of zero induction φ0. b Measured magnetoelectric coefficients as a function of frequency from the nanowire arrays at angles of approximately no inductive effects, φmin,ind = 177°, the angle of maximum constructive induction, φmin,ind + 90°, and maximum destructive induction, φmin,ind + 90°
Fig. 14
Fig. 14
a Schematic diagram of the lock-in magnetoelectric measurement setup. Here a large DC bias H-field can be applied to the nanowire arrays alongside an AC H-field. Lock-in amplifiers, phase-locked to the magnetic field signal are used to measure the voltage from the nanowire array. The low noise preamplifier was used to amplify the Hall probe signal to help maintain phase lock to the field. b Schematic of the nanowire array showing the direction of the applied AC and DC fields in relation to the nanowire axis
Fig. 15
Fig. 15
Schematic of the rotating magnetoelectric measurement setup, where the angle of the array with respect to the applied magnetic field can be adjusted to explore the effects of induction on the measured magnetoelectric coefficient

References

    1. Nan CW, Bichurin MI, Dong S, Viehland D, Srinivasan G. Multiferroic magnetoelectric composites: Historical perspective, status, and future directions. J. Appl. Phys. 2008;103:031101. doi: 10.1063/1.2836410. - DOI
    1. Spaldin NA, Fiebig M. Materials science. The renaissance of magnetoelectric multiferroics. Science. 2005;309:391–392. doi: 10.1126/science.1113357. - DOI - PubMed
    1. Bichurin MI, Petrov VM, Srinivasan G. Low-frequency magnetoelectric effects in ferrite–piezoelectric nanostructures. J. Magn. Magn. Mater. 2009;321:846–849. doi: 10.1016/j.jmmm.2008.11.084. - DOI
    1. Yan L, et al. Review of magnetoelectric perovskite–spinel self-assembled nano-composite thin films. J. Mater. Sci. 2009;44:5080–5094. doi: 10.1007/s10853-009-3679-1. - DOI
    1. Ma YG, Cheng WN, Ning M, Ong CK. Magnetoelectric effect in epitaxial Pb(Zr0.52Ti0.48)O3∕La0.7Sr0.3MnO3 composite thin film. Appl. Phys. Lett. 2007;90:152911. doi: 10.1063/1.2723645. - DOI