. 2018 May;33(5):511-529.
doi: 10.1002/2017PA003222. Epub 2018 May 23.

Orbitally Forced Hyperstratification of the Oligocene South Atlantic Ocean

Affiliations

Orbitally Forced Hyperstratification of the Oligocene South Atlantic Ocean

Diederik Liebrand et al. Paleoceanogr Paleoclimatol. 2018 May.

Abstract

Pelagic sediments from the subtropical South Atlantic Ocean contain geographically extensive Oligocene ooze and chalk layers that consist almost entirely of the calcareous nannofossil Braarudosphaera. Poor recovery and the lack of precise dating of these horizons in previous studies has limited the understanding of the number of acmes, their timing and durations, and therefore their likely cause. Here we present a high-resolution, astronomically tuned stratigraphy of Braarudosphaera oozes (29.5-27.9 Ma) from Ocean Drilling Program Site 1264 in the southeastern Atlantic Ocean. We identify seven episodes with highly abundant Braarudosphaera. Four of these acme events coincide with maxima and three with minima in the ~110 and 405-kyr paced eccentricity cycles. The longest lasting acme event corresponds to a pronounced minimum in the ~2.4-Myr eccentricity cycle. In the modern ocean, Braarudosphaera occurrences are limited to shallow marine and neritic settings, and the calcified coccospheres of Braarudosphaera are probably produced during a resting stage in the algal life cycle. Therefore, we hypothesize that the Oligocene acmes point to extensive and episodic (hyper) stratified surface water conditions, with a shallow pycnocline that may have served as a virtual seafloor and (partially/temporarily) prevented the coccospheres from sinking in the pelagic realm. We speculate that hyperstratification was either extended across large areas of the South Atlantic basin, through the formation of relatively hyposaline surface waters, or eddy contained through strong isopycnals at the base of eddies. Astronomical forcing of atmospheric and/or oceanic circulation could have triggered these conditions through either sustained rainfall over the open ocean and adjacent land masses or increased Agulhas Leakage.

Keywords: Braarudosphaera acmes; Oligocene; astronomical forcing of atmospheric and oceanic fronts; eddies; monsoons; surface ocean stratification.


Figures

Figure 1
Figure 1
Geographic extent of Braarudosphaera‐rich layers. Modern geography of the South Atlantic Ocean with the locations of Deep Sea Drilling Project (DSDP) and Ocean Drilling Program (ODP) drill sites (brown areas with chalk pattern) where mid‐Oligocene Braarudosphaera‐rich layers have been recovered. For South Atlantic Ocean sites information from the relevant DSDP and ODP site reports is recompiled. Blue lines on continents represent modern‐day rivers that may have delivered fresh waters to the South Atlantic surface ocean. Light blue areas project the potential mid‐Oligocene extent of seasonally recurrent surface ocean stratification caused by increased precipitation over the sea, possibly aided by increased continental runoff closer to the coasts, indicated by a darker blue. According to the eccentricity‐tuned age model (Liebrand et al., 2016), the Braarudosphaera oozes are present on oceanic crust ≥27.9 Ma. This figure is an adaptation of figures from references: Kelly et al. (2003), O'Connor and Duncan (1990), Parker et al. (1985), and Peleo‐Alampay et al. (1999) and combines geographic information and anomaly profiles of http://www.odsn.de and http://www.serg.unicam.it, respectively.
Figure 2
Figure 2
Modern sea surface salinity, nitrate concentration, and phosphate concentration. (a) Sea surface salinity, which shows relatively high salinity in the modern South Atlantic Ocean. (b) Sea surface nitrate concentration and (c) sea surface phosphate concentration, which show relatively oligotrophic conditions in the modern South Atlantic Ocean. Data taken from http://www.ewoce.org.
Figure 3
Figure 3
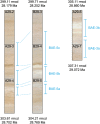
Core photographs of Braarudosphaera oozes. On‐splice and off‐splice examples of the lithologic expression of Braarudosphaera Acme Events (BAEs) 3, 5a, and 5b at Site 1264. Strong color variability between and within the acmes can be observed, suggesting higher‐frequency precession and/or obliquity forcing. The color contrast of the images is enhanced.
Figure 4
Figure 4
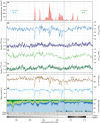
Stratigraphy across the Braarudosphaera oozes for Walvis Ridge ODP Leg 208 Sites 1264 and 1265. The data records are presented against stratigraphic depth (armcd = adjusted revised meters composite depth, see Liebrand et al. (2016)). (a) Braarudosphaera spp. abundances. The biohorizons Base Sphenolithus ciperoensis and Base Sphenolithus distentus are indicated. (b–e) Stable isotope records. (b) Bulk and (c) benthic foraminiferal (Cibicides mundulus) δ18O records. (d) Bulk and (e) benthic foraminiferal (Cibicides mundulus) δ13C records. (f–i) Lithological records. (f) CaCO3 estimates for Sites 1264 (dark brown) and 1265 (light brown). Percentages refer to dry weights (i.e., after freeze‐drying). (g) Water content of samples. Percentages refer to total sample weights (i.e., before freeze‐drying). (h) Size fraction records from Site 1264. Percentages as in panel (f). (i) Core photographs from Site 1264. Apparent cyclicity results from uneven lighting conditions when the photographs were taken. Red crosses and shaded area indicate short recovery gaps at Site 1264. These gaps are covered by data from nearby Site 1265 (both X‐ray fluorescence and isotopes). (j) Magnetostratigraphy from Site 1266 transposed to Site 1264 depth (Liebrand et al., 2016). The shaded gray areas indicate that the polarity signal is ambiguous in these intervals.
Plate 1
Plate 1
Micrographs of calcareous nannofossils. (a–c) Scanning electron microscope (SEM) micrographs of Braarudosphaera spp. pentaliths. Specimens show strong overgrowth of calcite and micron‐sized crystals and particles. Disintegrated fragments of Braarudosphaera can be seen in the background. (d–f) SEM micrographs of Discoaster specimens show strong calcite overgrowth. (d) Discoaster deflandrei and Zygrhablithus bijugatus. (e) Discoaster deflandrei. (f) Discoaster cf. D. tanii. (g–i) Light microscope micrographs of Braarudosphaera spp., (g and h) Parallel light. (i) Crossed‐polarized light. Horizontal bars in all micrographs are 5 μm, apart from panel (a) where the bar represents 50 μm. Samples ordered with increasing depth/age: (d and e) 208‐1264A‐29H‐3W, 137.5‐138.5 cm, 301.985 armcd, 28.533 Ma. (h) 208‐1264A‐29H‐3W, 150.0‐151.0 cm, 302.105 armcd, 28.546 Ma. (a–c, g, and i) 208‐1264A‐29H‐4W, 17.5‐18.5 cm, 302.285 armcd, 28.565 Ma. (f) 208‐1264A‐30H‐5W, 12.5‐13.5 cm, 314.42 armcd, 29.735 Ma.
Figure 5
Figure 5
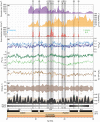
Astrochronology for the mid‐Oligocene Braarudosphaera acmes. The data records are presented against eccentricity‐tuned age (Liebrand et al., 2016). (a–c) Calcareous nannofossil records. (a) Discoaster spp. abundances. (b) Zygrhablithus bijugatus abundances. (c) Braarudosphaera spp. abundances. Vertical gray bars correspond to the Braarudosphaera acmes. The biohorizons Base Sphenolithus ciperoensis and Base Sphenolithus distentus are indicated. (d and e) Stable isotope records. (d) Bulk (light blue) and benthic (dark blue) foraminiferal (Cibicides mundulus) δ18O records. (e) Bulk (light green) and benthic (dark green) foraminiferal (Cibicides mundulus) δ13C records. (f) CaCO3 estimates for Sites 1264 (dark brown) and 1265 (light brown). (g and h) Astronomical solutions. (g) Earth's obliquity modulation (Laskar et al., 2004). (h) Earth's orbital eccentricity solution (dark gray, La2011_ecc3L, (Laskar et al., 2011)) and its ~2.4‐Myr component (light brown). (i) Magnetostratigraphy from Walvis Ridge (WALV). PMAG = magnetostratigraphy. (j) The geologic (magnetic polarity) time scale (GTS2012, (Vandenberghe et al., 2012)).
Figure 6
Figure 6
Spectral analyses on carbonate content. (a) Evolutive spectral analysis and singular spectrum analysis on the CaCO3 record using a multitaper method (Ghil et al., 2002). (b) Wavelet analysis and global spectrum analysis on the CaCO3 record. Black lines on the wavelet analysis and red lines on the spectral analyses represent the 95% confidence level. White shaded area in top right corner represents the “cone of influence,” where edge effects become important (Grinsted et al., 2004). For both panels: Blue colors indicate low spectral power and red colors indicate high spectral power.
Figure 7
Figure 7
Eccentricity pacing of Braarudosphaera acme events. (a) Gaussian filter of the Braarudosphaera spp. abundance record centered around the 405‐kyr periodicity (i.e., frequency = 2.5, bandwidth = 0.5, (Paillard et al., 1996)). (b) Braarudosphaera spp. abundance record. (c) Gaussian filter of the 405‐kyr eccentricity periodicity. (d) Earth's orbital eccentricity (Laskar et al., 2011). Vertical red lines correspond to Braarudosphaera acmes that occurred during 405 and ~110‐kyr eccentricity maxima. Vertical blue lines show those acmes that correspond to 405‐ and ~110‐kyr eccentricity minima.
Figure 8
Figure 8
Links between atmospheric circulation, hyperstratification, and Braarudosphaera acmes. Atmospheric circulation and areal extent of the Braarudosphaera acmes drawn on a paleogeographic reconstruction for the mid‐Oligocene (~28.5 Ma, http://www.odsn.de). ITCZ stands for intertropical convergence zone. SHPB stands for subtropical high‐pressure belt, PCZ stands for polar convergence zone. H = area of generally high air pressure. L = area of generally low air pressure. This figure is based on those by Parker et al. (1985) and Peleo‐Alampay et al. (1999).
Figure 9
Figure 9
Monsoon Hypothesis (a and b) and Eddy Hypothesis (c). (a) EC‐Earth modeling output shows the influence of precession extremes on precipitation redistribution across the globe using modern‐day geography (Bosmans, Hilgen, et al., 2015; Bosmans, Drijfhout, Tuenter, Hilgen, & Lourens, 2015). P stands for precession. (b) Modeling output of a transient simulation of climate evolution of the past 21 kyr using a fully coupled global climate model (i.e., CCSM3) that includes radiative forcing. It shows that during the last glaciation meridional overturning circulation has the largest control on tropical moisture distribution (Liu et al., 2009; Otto‐Bliesner et al., 2014). HS1 stands for Heinrich Stadial 1. LGM stands for Last Glacial Maximum. The relevance of these models to the Oligocene is that they both show a latitudinal rainfall band across the South Atlantic Ocean. Panels a and b are adapted from Mohtadi et al. (2016). (c) Approximate pathways of Benguela Current‐derived cyclonic and anticyclonic eddies (purple) and Agulhas rings (teal), which are almost all anticyclonic in the modern. This panel is loosely based on satellite altimetry data presented in Chelton et al. (2011), Pegliasco et al. (2015), Schouten et al. (2000), Souza et al. (2011), and Wang et al. (2015).

References

    1. Agnini, C. , Fornaciari, E. , Raffi, I. , Catanzariti, R. , Pälike, H. , Backman, J. , & Rio, D. (2014). Biozonation and biochronology of Paleogene calcareous nannofossils from low and middle latitudes. Newsletters on Stratigraphy, 47(2), 131–181. 10.1127/0078-0421/2014/0042 - DOI
    1. Arhan, M. , Mercier, H. , & Lutjeharms, J. R. E. (1999). The disparate evolution of three Agulhas rings in the South Atlantic Ocean. Journal of Geophysical Research, 104(C9), 20,987–21,005. 10.1029/1998JC900047 - DOI
    1. Backman, J. , & Shackleton, N. J. (1983). Quantitative biochronology of Pliocene and early Pleistocene calcareous nannofossils from the Atlantic, Indian and Pacific Oceans. Marine Micropaleontology, 8(2), 141–170. 10.1016/0377-8398(83)90009-9 - DOI
    1. Bard, E. , & Rickaby, R. E. M. (2009). Migration of the subtropical front as a modulator of glacial climate. Nature, 460(7253), 380–383. 10.1038/nature08189 - DOI - PubMed
    1. Bartol, M. , Pavšič, J. , Dobnikar, M. , & Bernasconi, S. M. (2008). Unusual Braarudosphaera bigelowii and Micrantholithus vesper enrichment in the Early Miocene sediments from the Slovenian Corridor, a seaway linking the Central Paratethys and the Mediterranean. Palaeogeography, Palaeoclimatology, Palaeoecology, 267(1‐2), 77–88. 10.1016/j.palaeo.2008.06.005 - DOI