. 2019 Nov;29(11):1049-1062.
doi: 10.1002/hipo.23097. Epub 2019 May 6.

Functional connectivity along the anterior-posterior axis of hippocampal subfields in the ageing human brain

Affiliations

Functional connectivity along the anterior-posterior axis of hippocampal subfields in the ageing human brain

Marshall A Dalton et al. Hippocampus. 2019 Nov.

Erratum in

  • Erratum.
    [No authors listed] [No authors listed] Hippocampus. 2020 Aug;30(8):909. doi: 10.1002/hipo.23249. Hippocampus. 2020. PMID: 32812312 Free PMC article. No abstract available.

Abstract

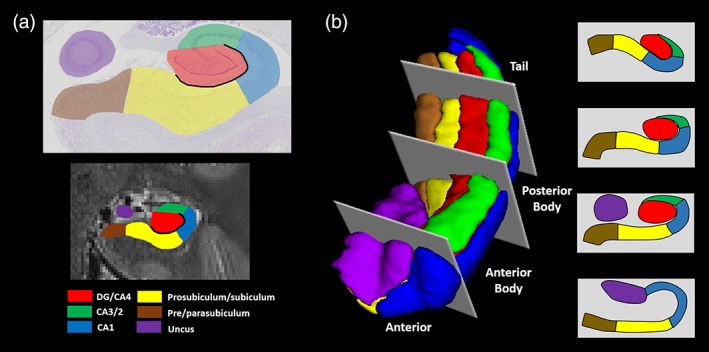
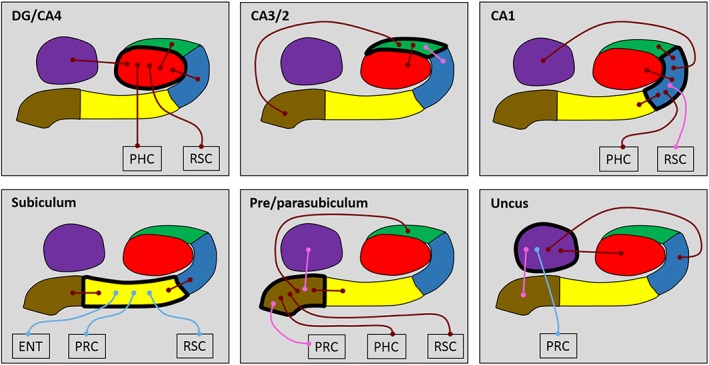
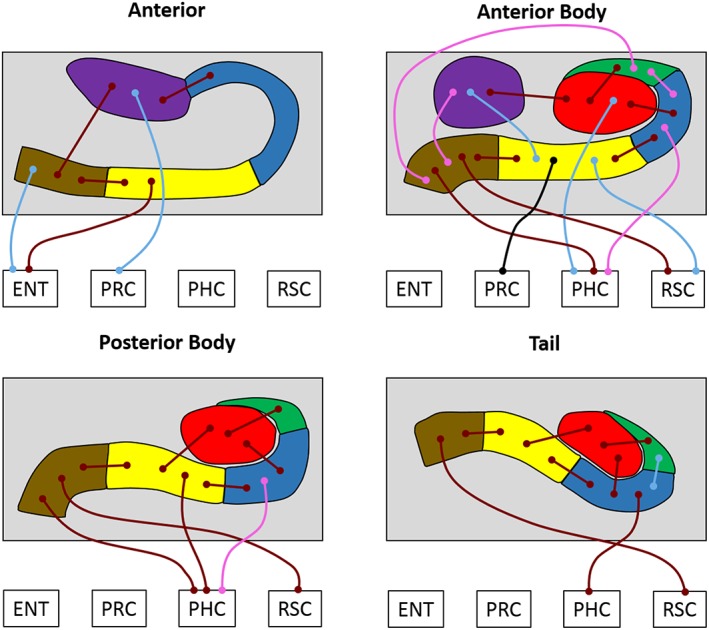
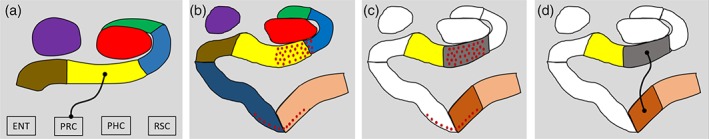
While age-related volumetric changes in human hippocampal subfields have been reported, little is known about patterns of subfield functional connectivity (FC) in the context of healthy ageing. Here we investigated age-related changes in patterns of FC down the anterior-posterior axis of each subfield. Using high resolution structural MRI we delineated the dentate gyrus (DG), CA fields (including separating DG from CA3), the subiculum, pre/parasubiculum, and the uncus in healthy young and older adults. We then used high resolution resting state functional MRI to measure FC in each group and to directly compare them. We first examined the FC of each subfield in its entirety, in terms of FC with other subfields and with neighboring cortical regions, namely, entorhinal, perirhinal, posterior parahippocampal, and retrosplenial cortices. Next, we analyzed subfield to subfield FC within different portions along the hippocampal anterior-posterior axis, and FC of each subfield portion with the neighboring cortical regions of interest. In general, the FC of the older adults was similar to that observed in the younger adults. We found that, as in the young group, the older group displayed intrinsic FC between the subfields that aligned with the tri-synaptic circuit but also extended beyond it, and that FC between the subfields and neighboring cortical areas differed markedly along the anterior-posterior axis of each subfield. We observed only one significant difference between the young and older groups. Compared to the young group, the older participants had significantly reduced FC between the anterior CA1-subiculum transition region and the transentorhinal cortex, two brain regions known to be disproportionately affected during the early stages of age-related tau accumulation. Overall, these results contribute to ongoing efforts to characterize human hippocampal subfield connectivity, with implications for understanding hippocampal function and its modulation in the ageing brain.

Keywords: ageing; functional connectivity; hippocampal subfields; perirhinal cortex; subiculum; tau.


Conflict of interest statement

The authors declare no conflict of interest.

Figures

Figure 1
Figure 1
Subregions of the human hippocampus. (a) Top panel: a section of postmortem human hippocampus stained with cresyl violet to visualise cell bodies and overlaid with hippocampal subregion masks. Bottom panel: a T2‐weighted structural MRI scan of the human hippocampus overlaid with hippocampal subregion masks. (b) Left panel: a 3D model of hippocampal subregion masks with representative examples of demarcation points for anterior, anterior body, posterior body and tail portions of the subfields. Right panel: schematic representation of the subfields present in each portion of the hippocampus [Color figure can be viewed at http://wileyonlinelibrary.com]
Figure 2
Figure 2
Results of the whole subfield analyses for the young and older participant groups. The relevant subfield in each panel is outlined in a thick black line. The thin lines with circular termini represent significant correlations of activity with the activity in other hippocampal subfields and/or extra‐hippocampal ROIs. Dark red lines represent significant correlations common to both young and old groups. Light blue lines represent significant correlations present only in the young group. Pink lines represent significant correlations present only in the older group. DG/CA4 (red), CA3/2 (green), CA1 (blue), subiculum (yellow), pre/parasubiculum (brown), uncus (purple); ENT, entorhinal cortex; PHC, posterior parahippocampal cortex; PRC, perirhinal cortex; RSC, retrosplenial cortex [Color figure can be viewed at http://wileyonlinelibrary.com]
Figure 3
Figure 3
Results of the longitudinal subfield analyses for the young and older participant groups. The thin lines with circular termini represent significant correlations of activity with the activity in other hippocampal subfields and/or extra‐hippocampal ROIs. Dark red lines represent significant correlations common to both young and old groups. Light blue lines represent significant correlations present only in the young group. Pink lines represent significant correlations present only in the older group. The black line represents a significant increase in FC for young compared to older participants. DG/CA4 (red), CA3/2 (green), CA1 (blue), subiculum (yellow), pre/parasubiculum (brown), uncus (purple); ENT, entorhinal cortex; PHC, posterior parahippocampal cortex; PRC, perirhinal cortex; RSC, retrosplenial cortex [Color figure can be viewed at http://wileyonlinelibrary.com]
Figure 4
Figure 4
Exploratory analysis. (a) Results of the contrast of the young > older group for the AB hippocampus revealing the subiculum had reduced FC with the PRC in the older participants (thin black line with circular termini). DG/CA4 (red), CA3/2 (green), CA1 (blue), subiculum (yellow), pre/parasubiculum (brown), uncus (purple); ENT, entorhinal cortex; PHC, posterior parahippocampal cortex; PRC, perirhinal cortex; RSC, retrosplenial cortex. (b) Representation of our original segmentation scheme overlaid with red dots representing areas implicated in early (Stage 1) tau accumulation (adapted from Lace et al., 2009). Note the pattern of tau accumulation is largely restricted to the CA1‐subiculum transition region (predominantly within our subiculum mask) and the transentorhinal cortex (predominantly within our perirhinal cortex mask) during these early stages. (c) Representation of our amended segmentation scheme to create ROIs for the putatively tau‐affected CA1‐subiculum transition zone (grey) and transentorhinal cortex (rust). Amended ROIs for the medial subiculum (yellow) and lateral perirhinal cortex (coral) are also displayed. (d) Results for the contrast of the young > older group revealed the CA1‐subiculum transition region had reduced FC with the transentorhinal cortex in the older participants (thin black line with circular termini) [Color figure can be viewed at http://wileyonlinelibrary.com]

References

    1. Adler, D. H. , Pluta, J. , Kadivar, S. , Craige, C. , Gee, J. C. , Avants, B. B. , & Yushkevich, P. A. (2014). Histology‐derived volumetric annotation of the human hippocampal subfields in postmortem MRI. NeuroImage, 84, 505–523. 10.1016/j.neuroimage.2013.08.067 - DOI - PMC - PubMed
    1. Aggleton, J. P. (2012). Multiple anatomical systems embedded within the primate medial temporal lobe: implications for hippocampal function. Neuroscience and Biobehavioral Reviews, 36(7), 1579–1596. 10.1016/j.neubiorev.2011.09.005 - DOI - PubMed
    1. Aggleton, J. P. , & Christiansen, K. (2015). The subiculum: The heart of the extended hippocampal system. Progress in Brain Research, 219, 65–82. 10.1016/bs.pbr.2015.03.003 - DOI - PubMed
    1. Agster, K. L. , & Burwell, R. D. (2013). Hippocampal and subicular efferents and afferents of the perirhinal, postrhinal, and entorhinal cortices of the rat. Behavioral Brain Research, 254, 50–64. 10.1016/j.bbr.2013.07.005 - DOI - PMC - PubMed
    1. Augustinack, J. C. , Huber, K. E. , Stevens, A. A. , Roy, M. , Frosch, M. P. , van der Kouwe, A. J. , … the Alzheimer's Disease Neuroimaging Initiative . (2013). Predicting the location of human perirhinal cortex, Brodmann's area 35, from MRI. NeuroImage, 64, 32–42. 10.1016/j.neuroimage.2012.08.071 - DOI - PMC - PubMed

Publication types