Review
. 2019 May-Jun;39(3):729-743.
doi: 10.1148/rg.2019180115.

Photon-counting Detector CT: System Design and Clinical Applications of an Emerging Technology

Affiliations
Review

Photon-counting Detector CT: System Design and Clinical Applications of an Emerging Technology

Shuai Leng et al. Radiographics. 2019 May-Jun.

Abstract

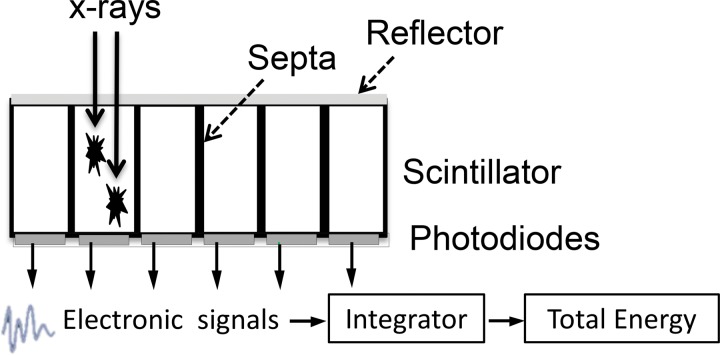
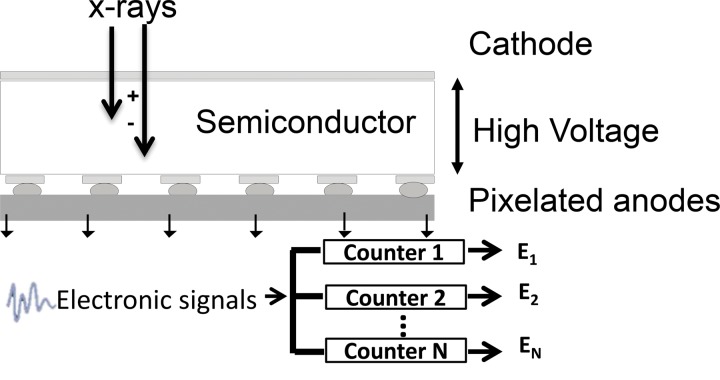
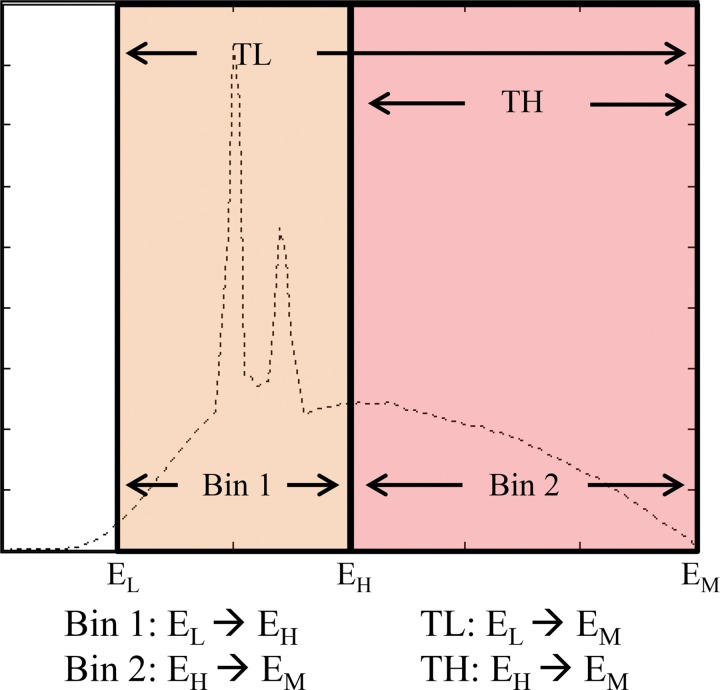
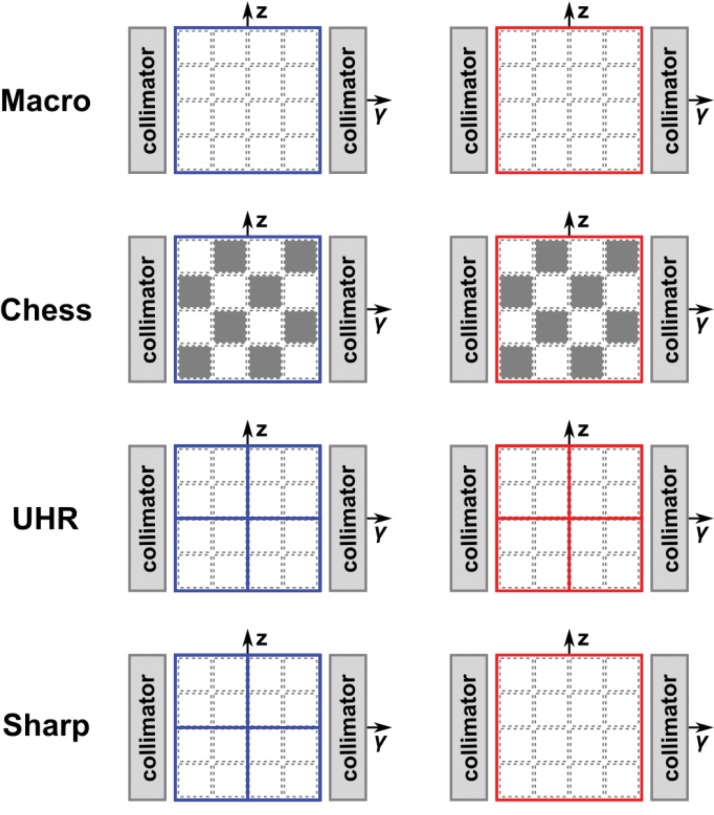
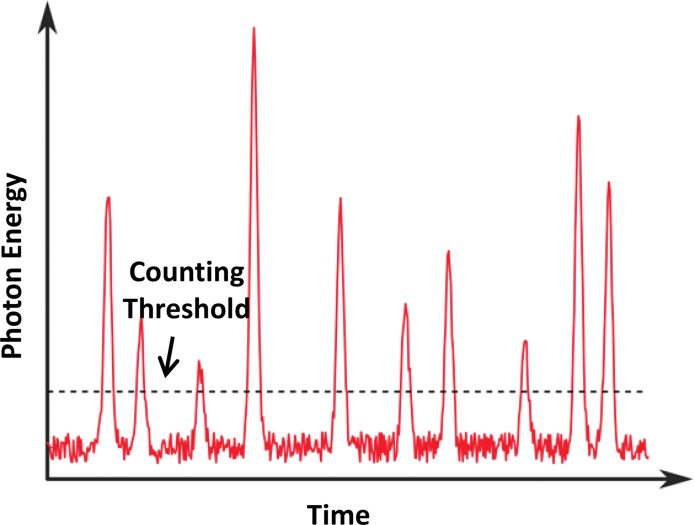
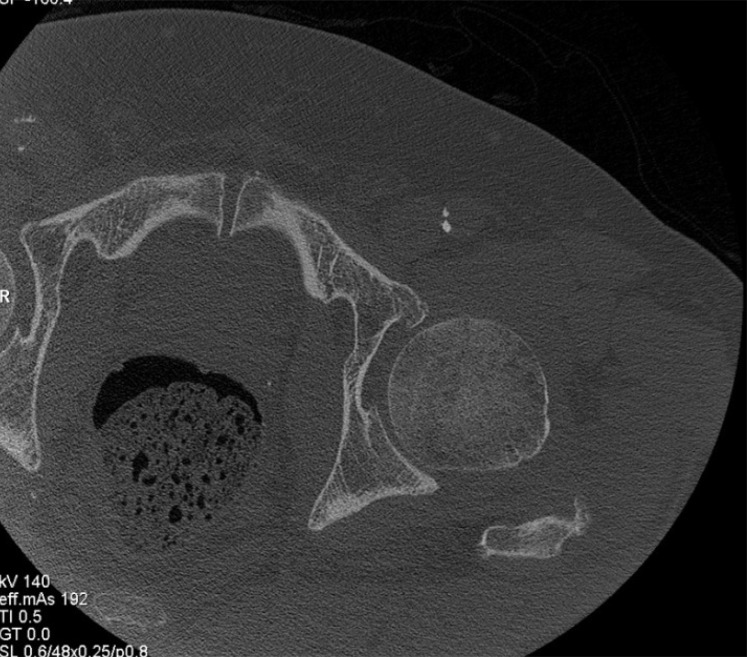
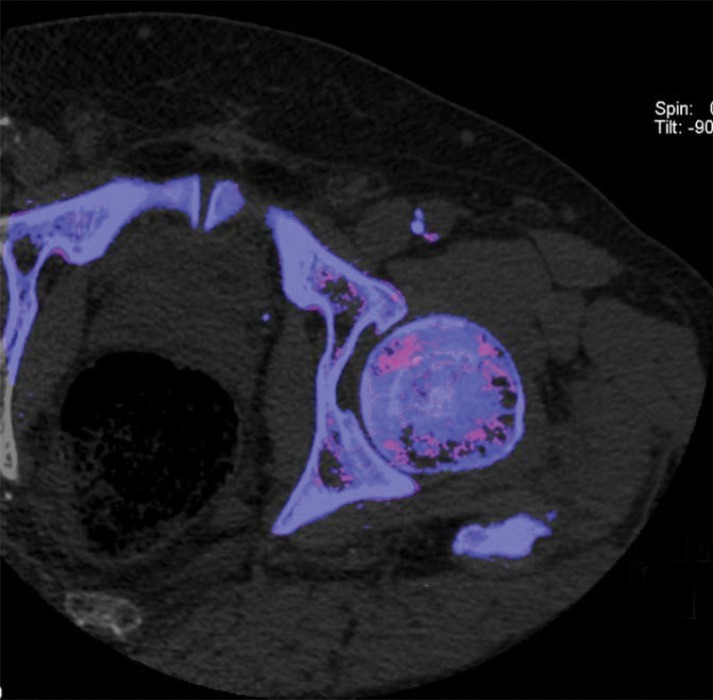
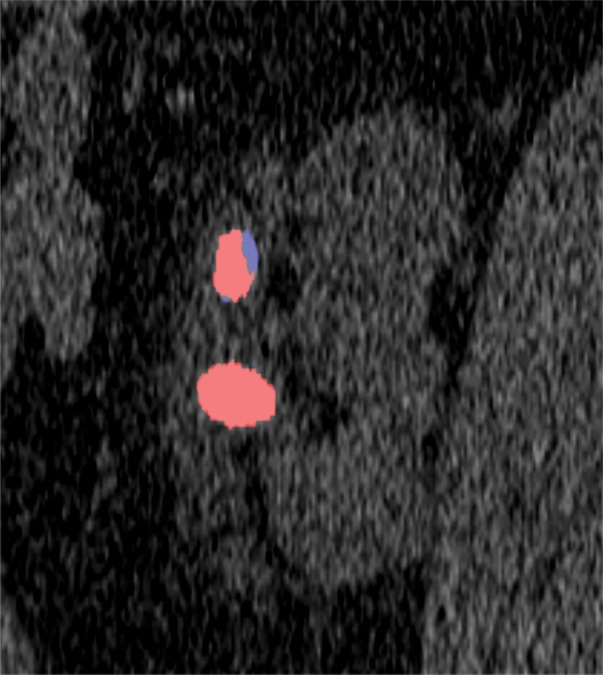
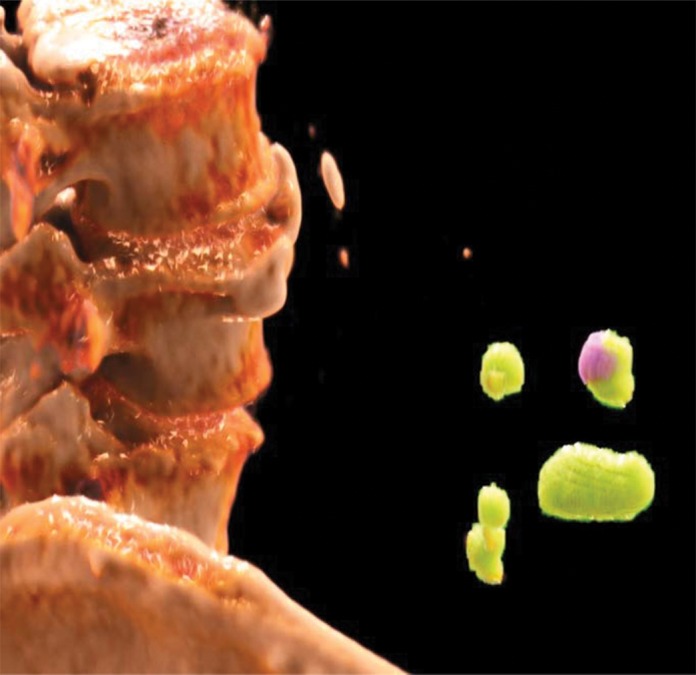
Photon-counting detector (PCD) CT is an emerging technology that has shown tremendous progress in the last decade. Various types of PCD CT systems have been developed to investigate the benefits of this technology, which include reduced electronic noise, increased contrast-to-noise ratio with iodinated contrast material and radiation dose efficiency, reduced beam-hardening and metal artifacts, extremely high spatial resolution (33 line pairs per centimeter), simultaneous multienergy data acquisition, and the ability to image with and differentiate among multiple CT contrast agents. PCD technology is described and compared with conventional CT detector technology. With the use of a whole-body research PCD CT system as an example, PCD technology and its use for in vivo high-spatial-resolution multienergy CT imaging is discussed. The potential clinical applications, diagnostic benefits, and challenges associated with this technology are then discussed, and examples with phantom, animal, and patient studies are provided. ©RSNA, 2019.


Figures

Figure 1a.
Figure 1a.
Schematic drawings illustrate the principles of EID (a) and PCD (b) technologies.
Figure 1b.
Figure 1b.
Schematic drawings illustrate the principles of EID (a) and PCD (b) technologies.
Figure 2.
Figure 2.
PCD datasets for the x-ray tube potential or energy maximum (EM) and two energy thresholds (low-energy [EL] and high-energy [EH] thresholds): the two threshold datasets (low threshold [TL] and high threshold [TH]) correspond to photons with energy levels higher than the respective thresholds (EL, EH) but lower than the tube potential (EM), and two bin data (Bin 1 and Bin 2) corresponding to photons with energy levels between (arrow between energy levels) the two energy thresholds (Bin 1) or between the high-energy threshold and the tube potential (Bin 2). Note that high-threshold and Bin 2 data are identical. (Adapted and reprinted, with permission, from reference .)
Figure 3a.
Figure 3a.
A whole-body research PCD CT scanner capable of human imaging at a clinical dose rate was built on the basis of a dual-source CT system with one of the EID arrays replaced with a cadmium telluride–based PCD array (a). The PCD CT system has four different acquisition modes (macro, chess, ultra-high-resolution [UHR], and sharp modes), each corresponding to a specific detector configuration (b). (Fig 3a adapted and reprinted, with permission, from reference .)
Figure 3b.
Figure 3b.
A whole-body research PCD CT scanner capable of human imaging at a clinical dose rate was built on the basis of a dual-source CT system with one of the EID arrays replaced with a cadmium telluride–based PCD array (a). The PCD CT system has four different acquisition modes (macro, chess, ultra-high-resolution [UHR], and sharp modes), each corresponding to a specific detector configuration (b). (Fig 3a adapted and reprinted, with permission, from reference .)
Figure 4a.
Figure 4a.
The shoulder section of a thorax phantom reconstructed from data acquired with EID CT (a) and with PCD CT (b) using the same x-ray tube potential and radiation dose. Compared with the image acquired with EID CT, the PCD CT image has noticeably fewer horizontal streaking artifacts and an overall more uniform appearance, which indicates that electronic noise has a more noticeable effect on the EID image than on the PCD image. (Reprinted, with permission, from reference .)
Figure 4b.
Figure 4b.
The shoulder section of a thorax phantom reconstructed from data acquired with EID CT (a) and with PCD CT (b) using the same x-ray tube potential and radiation dose. Compared with the image acquired with EID CT, the PCD CT image has noticeably fewer horizontal streaking artifacts and an overall more uniform appearance, which indicates that electronic noise has a more noticeable effect on the EID image than on the PCD image. (Reprinted, with permission, from reference .)
Figure 5.
Figure 5.
Graph shows signals of individual x-ray photons detected with the use of a PCD, with additive electronic noise. The PCD is able to discriminate the energy of each incident x-ray photon. Since the electronic noise usually is detected as a low-amplitude signal, it can be excluded readily from the measured counting data by setting a proper counting energy threshold to be slightly higher than the energy level associated with the electronic noise amplitude.
Figure 6a.
Figure 6a.
Artifacts on EID and low- and high-energy PCD images. Axial EID (a), low-energy-threshold PCD (b), and high-energy-threshold PCD (c) CT images in a cadaver head (left images) and magnified images (right images) of the areas outlined in red squares show that the high-energy-threshold PCD CT images (c) have fewer blooming artifacts (arrows) and beam- hardening artifacts (arrowheads) than do the EID CT images (a) and low-energy-threshold PCD CT images (b). (Reprinted, with permission, from reference .)
Figure 6b.
Figure 6b.
Artifacts on EID and low- and high-energy PCD images. Axial EID (a), low-energy-threshold PCD (b), and high-energy-threshold PCD (c) CT images in a cadaver head (left images) and magnified images (right images) of the areas outlined in red squares show that the high-energy-threshold PCD CT images (c) have fewer blooming artifacts (arrows) and beam- hardening artifacts (arrowheads) than do the EID CT images (a) and low-energy-threshold PCD CT images (b). (Reprinted, with permission, from reference .)
Figure 6c.
Figure 6c.
Artifacts on EID and low- and high-energy PCD images. Axial EID (a), low-energy-threshold PCD (b), and high-energy-threshold PCD (c) CT images in a cadaver head (left images) and magnified images (right images) of the areas outlined in red squares show that the high-energy-threshold PCD CT images (c) have fewer blooming artifacts (arrows) and beam- hardening artifacts (arrowheads) than do the EID CT images (a) and low-energy-threshold PCD CT images (b). (Reprinted, with permission, from reference .)
Figure 7a.
Figure 7a.
Reduction of metal artifacts at PCD CT. Axial EID (a) and PCD (b) CT images of a fused lumbar spine in a 55-year-old man show that the reduction of metal artifacts arising from the posterior metallic hardware enables visualization of the spinal canal, which was obscured by the metal artifacts on a.
Figure 7b.
Figure 7b.
Reduction of metal artifacts at PCD CT. Axial EID (a) and PCD (b) CT images of a fused lumbar spine in a 55-year-old man show that the reduction of metal artifacts arising from the posterior metallic hardware enables visualization of the spinal canal, which was obscured by the metal artifacts on a.
Figure 8a.
Figure 8a.
CT imaging in UHR mode. In vivo axial CT image of the lung in a 69-year-old woman (a) and coronal CT image of the wrist in a 59-year-old man (b) show that high spatial resolution enables accurate delineation of lung fissures (arrow in a), airway walls (arrowhead in a), and trabecular bone.
Figure 8b.
Figure 8b.
CT imaging in UHR mode. In vivo axial CT image of the lung in a 69-year-old woman (a) and coronal CT image of the wrist in a 59-year-old man (b) show that high spatial resolution enables accurate delineation of lung fissures (arrow in a), airway walls (arrowhead in a), and trabecular bone.
Figure 9a.
Figure 9a.
Coronal EID (a) and PCD CT images acquired in UHR mode (b) show examples of a coronary stent. The PCD image clearly shows the individual struts, which are evident on the corresponding three-dimensional rendering (c) of the PCD CT image.
Figure 9b.
Figure 9b.
Coronal EID (a) and PCD CT images acquired in UHR mode (b) show examples of a coronary stent. The PCD image clearly shows the individual struts, which are evident on the corresponding three-dimensional rendering (c) of the PCD CT image.
Figure 9c.
Figure 9c.
Coronal EID (a) and PCD CT images acquired in UHR mode (b) show examples of a coronary stent. The PCD image clearly shows the individual struts, which are evident on the corresponding three-dimensional rendering (c) of the PCD CT image.
Figure 10a.
Figure 10a.
Axial EID image (a) and PCD CT image acquired in UHR mode (b) of a cadaveric temporal bone specimen. The conspicuity of the stapes superstructure (arrows) is higher on the PCD CT image, and noise reduction of 29% was achieved with PCD CT at matched dose levels. (Reprinted, with permission, from reference .)
Figure 10b.
Figure 10b.
Axial EID image (a) and PCD CT image acquired in UHR mode (b) of a cadaveric temporal bone specimen. The conspicuity of the stapes superstructure (arrows) is higher on the PCD CT image, and noise reduction of 29% was achieved with PCD CT at matched dose levels. (Reprinted, with permission, from reference .)
Figure 11a.
Figure 11a.
Sagittal single-energy CT angiogram (a) and iodine map (b) after material decomposition acquired with a whole-body PCD CT system in a living swine.
Figure 11b.
Figure 11b.
Sagittal single-energy CT angiogram (a) and iodine map (b) after material decomposition acquired with a whole-body PCD CT system in a living swine.
Figure 12a.
Figure 12a.
Sample PCD CT images, which were acquired with simultaneous high-spatial-resolution and multienergy capabilities, of the pelvis in a 72-year-old man. The high-spatial-resolution low-energy-threshold image (a) is used as a standard single-energy image for routine diagnosis, while dual-energy images can be processed for bone removal (b) or ruling out the presence of gout (c).
Figure 12b.
Figure 12b.
Sample PCD CT images, which were acquired with simultaneous high-spatial-resolution and multienergy capabilities, of the pelvis in a 72-year-old man. The high-spatial-resolution low-energy-threshold image (a) is used as a standard single-energy image for routine diagnosis, while dual-energy images can be processed for bone removal (b) or ruling out the presence of gout (c).
Figure 12c.
Figure 12c.
Sample PCD CT images, which were acquired with simultaneous high-spatial-resolution and multienergy capabilities, of the pelvis in a 72-year-old man. The high-spatial-resolution low-energy-threshold image (a) is used as a standard single-energy image for routine diagnosis, while dual-energy images can be processed for bone removal (b) or ruling out the presence of gout (c).
Figure 13a.
Figure 13a.
Renal stones in a 64-year-old man. (a) High-resolution single-energy PCD CT image shows the morphologic features of the stones. (b) Dual-energy image shows the stone composition. (c) Cinematic three-dimensional volume-rendered image enhances the visualization of stone morphology and composition.
Figure 13b.
Figure 13b.
Renal stones in a 64-year-old man. (a) High-resolution single-energy PCD CT image shows the morphologic features of the stones. (b) Dual-energy image shows the stone composition. (c) Cinematic three-dimensional volume-rendered image enhances the visualization of stone morphology and composition.
Figure 13c.
Figure 13c.
Renal stones in a 64-year-old man. (a) High-resolution single-energy PCD CT image shows the morphologic features of the stones. (b) Dual-energy image shows the stone composition. (c) Cinematic three-dimensional volume-rendered image enhances the visualization of stone morphology and composition.
Figure 14a.
Figure 14a.
Axial reconstructed images in a swine. (a, b) Low-threshold CT image (corresponding to 20–140 keV) (a) and energy bin CT image (20–25 keV) (b) reconstructed with standard filtered back projection. Note the higher noise in the energy bin image (b) compared with that in the low-threshold image (a). (c) Energy bin CT image reconstructed with the spectral prior image constrained compressed sensing technique from the same dataset as that for b shows reduced image noise and preserved spatial and spectral information. (Reprinted, with permission, from reference .)
Figure 14b.
Figure 14b.
Axial reconstructed images in a swine. (a, b) Low-threshold CT image (corresponding to 20–140 keV) (a) and energy bin CT image (20–25 keV) (b) reconstructed with standard filtered back projection. Note the higher noise in the energy bin image (b) compared with that in the low-threshold image (a). (c) Energy bin CT image reconstructed with the spectral prior image constrained compressed sensing technique from the same dataset as that for b shows reduced image noise and preserved spatial and spectral information. (Reprinted, with permission, from reference .)
Figure 14c.
Figure 14c.
Axial reconstructed images in a swine. (a, b) Low-threshold CT image (corresponding to 20–140 keV) (a) and energy bin CT image (20–25 keV) (b) reconstructed with standard filtered back projection. Note the higher noise in the energy bin image (b) compared with that in the low-threshold image (a). (c) Energy bin CT image reconstructed with the spectral prior image constrained compressed sensing technique from the same dataset as that for b shows reduced image noise and preserved spatial and spectral information. (Reprinted, with permission, from reference .)

References

    1. The Organisation for Economic Co-operation and Development . Computed tomography (CT) exams (indicator). OECD website. https://data.oecd.org/healthcare/computed-tomography-ct-exams.htm. Published 2018. Accessed March 23, 2018.
    1. Shefer E, Altman A, Behling R, et al. . State of the art of CT detectors and sources: a literature review. Curr Radiol Rep 2013;1(1):76–91.
    1. Johnson T, Fink C, Schönberg SO, Reiser MF, eds. Dual energy CT in clinical practice. Heidelberg, Germany: Springer, 2011.
    1. McCollough CH, Leng S, Yu L, Fletcher JG. Dual- and multi-energy CT: principles, technical approaches, and clinical applications. Radiology 2015;276(3):637–653. - PMC - PubMed
    1. Johnson TR. Dual-energy CT: general principles. AJR Am J Roentgenol 2012;199(5 suppl):S3–S8. - PubMed