

Selection of trait-specific markers and multi-environment models improve genomic predictive ability in rice
- PMID: 31059529
- PMCID: PMC6502484
- DOI: 10.1371/journal.pone.0208871
Selection of trait-specific markers and multi-environment models improve genomic predictive ability in rice
Abstract
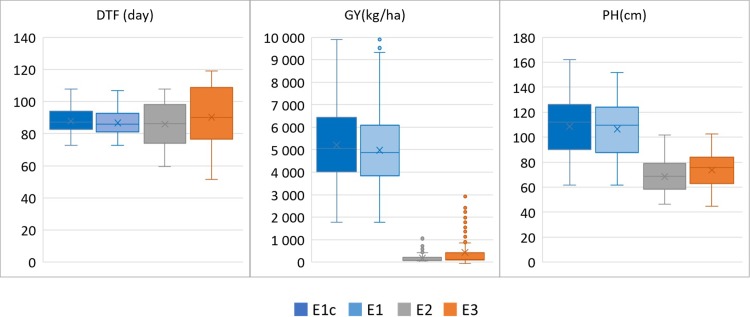
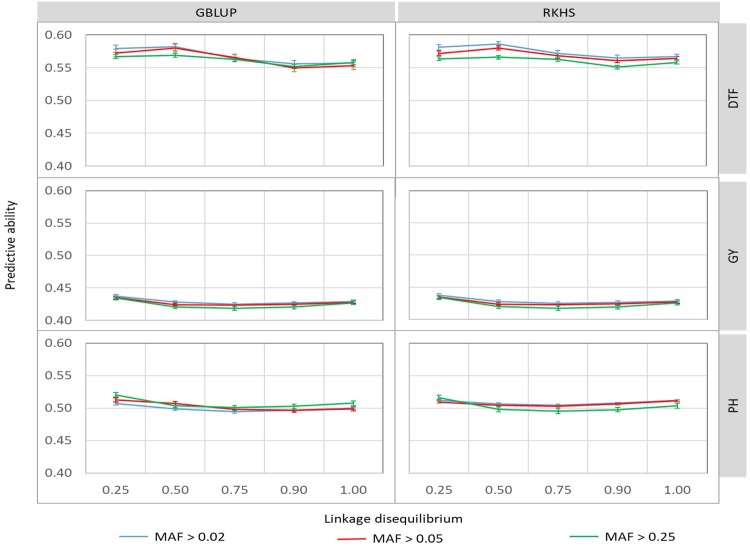
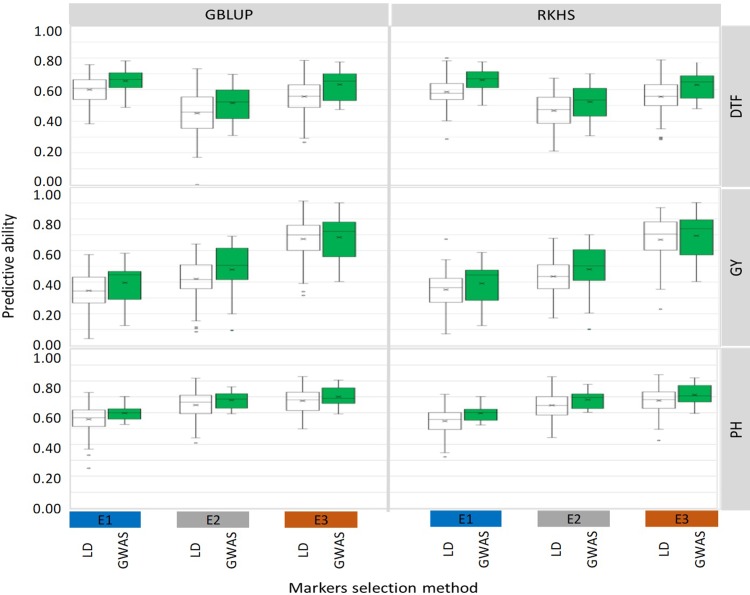
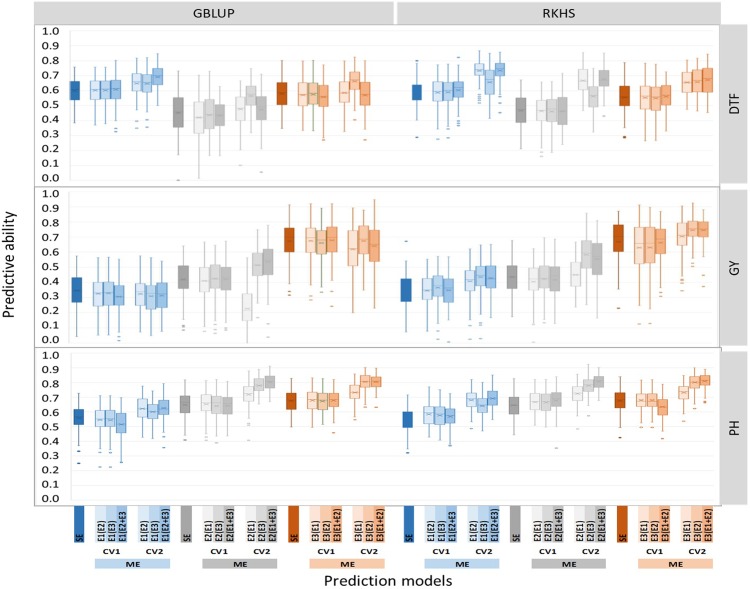
Developing high yielding rice varieties that are tolerant to drought stress is crucial for the sustainable livelihood of rice farmers in rainfed rice cropping ecosystems. Genomic selection (GS) promises to be an effective breeding option for these complex traits. We evaluated the effectiveness of two rather new options in the implementation of GS: trait and environment-specific marker selection and the use of multi-environment prediction models. A reference population of 280 rainfed lowland accessions endowed with 215k SNP markers data was phenotyped under a favorable and two managed drought environments. Trait-specific SNP subsets (28k) were selected for each trait under each environment, using results of GWAS performed with the complete genotype dataset. Performances of single-environment and multi-environment genomic prediction models were compared using kernel regression based methods (GBLUP and RKHS) under two cross validation scenarios: availability (CV2) or not (CV1) of phenotypic data for the validation set, in one of the environments. Trait-specific marker selection strategy achieved predictive ability (PA) of genomic prediction up to 22% higher than markers selected on the bases of neutral linkage disequilibrium (LD). Tolerance to drought stress was up to 32% better predicted by multi-environment models (especially RKHS based models) under CV2 strategy. Under the less favorable CV1 strategy, the multi-environment models achieved similar PA than the single-environment predictions. We also showed that reasonable PA could be obtained with as few as 3,000 SNP markers, even in a population of low LD extent, provided marker selection is based on pairwise LD. The implications of these findings for breeding for drought tolerance are discussed. The most resource sparing option would be accurate phenotyping of the reference population in a favorable environment and under a managed drought, while the candidate population would be phenotyped only under one of those environments.
Conflict of interest statement
The authors have declared that no competing interests exist.
Figures
References
-
- Serraj R, Kumar A, McNally KL, Slamet-Loedin I, Bruskiewich R, Mauleon R et al. Improvement of drought resistance in rice. Adv Agron. 2009; 103: 41–98. 10.1016/S0065-2113(09)03002-8 - DOI
-
- Bouman BA M, Humphreys E, Tuong TP, Barker R. Rice and water. Adv. Agron. 2006; 92: 187–237.
-
- Rosielle AA, Hamblin J. Theoretical aspects of selection for yield in stress and non-stress environments. Crop Sci. 1981; 21: 943–946.
-
- Edmeades GO, Bolanos J, Lafitte HR, Rajaram S, Pfeiffer W, Fischer RA. Traditional approaches to breeding for drought resistance in cereals In ‘‘Drought Resistance in Cereals” (Baker F. W. G., Ed.); pp. 27–52. CAB International, Wallingford, Oxon, UK: 1989.
-
- Fukai S, Cooper M. Development of drought-resistant cultivars using physiomorphological traits in rice. Field Crop Res. 1989; 40: 67–86.
Publication types
MeSH terms
LinkOut - more resources
Full Text Sources
Other Literature Sources
Research Materials
