Visualizing learner engagement, performance, and trajectories to evaluate and optimize online course design
- PMID: 31059546
- PMCID: PMC6502341
- DOI: 10.1371/journal.pone.0215964
Visualizing learner engagement, performance, and trajectories to evaluate and optimize online course design
Abstract
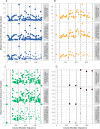
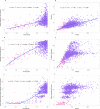
Learning analytics and visualizations make it possible to examine and communicate learners' engagement, performance, and trajectories in online courses to evaluate and optimize course design for learners. This is particularly valuable for workforce training involving employees who need to acquire new knowledge in the most effective manner. This paper introduces a set of metrics and visualizations that aim to capture key dynamical aspects of learner engagement, performance, and course trajectories. The metrics are applied to identify prototypical behavior and learning pathways through and interactions with course content, activities, and assessments. The approach is exemplified and empirically validated using more than 30 million separate logged events that capture activities of 1,608 Boeing engineers taking the MITxPro Course, "Architecture of Complex Systems," delivered in Fall 2016. Visualization results show course structure and patterns of learner interactions with course material, activities, and assessments. Tree visualizations are used to represent course hierarchical structures and explicit sequence of content modules. Learner trajectory networks represent pathways and interactions of individual learners through course modules, revealing patterns of learner engagement, content access strategies, and performance. Results provide evidence for instructors and course designers for evaluating the usage and effectiveness of course materials and intervention strategies.
Conflict of interest statement
Michael Richey and Mark Cousino are employed by The Boeing Company. Michael Ginda and Katy Börner were partially supported by The Boeing Company. There are no patents, products in development or marketed products to declare. This does not alter our adherence to all the PLOS ONE policies on sharing data and materials.
Figures


References
-
- Richey MC, Hamilton M, Madni AM. Boeing’s Investment and Returns in Learning, Knowledge Creation and Profitability Conference on Systems Engineering Research (CSER); Redondo Beach, CA: International Council on Systems Engineering; 2014.
-
- Shah D. By The Numbers: MOOCS in 2017—Class Central: Class Central, Inc; 2018. [Available from: https://www.class-central.com/report/mooc-stats-2017/.
-
- Engineering technology education in the United States. Washington, DC: National Academies Press; 2016 2016.
-
- Bogdan R, Holotescu C, Andone D, Grosseck G. How MOOCS are Being Used for Corporate Training? eLearning & Software for Education. 2017;2.
-
- Hogle P. Hot or Not: How Do MOOCs Fit into Corporate eLearning? Santa Rosa, CA: eLearning Guild; 2017. [Available from: https://www.learningsolutionsmag.com/articles/2228/hot-or-not-how-do-moo....
Publication types
MeSH terms
Grants and funding
LinkOut - more resources
Full Text Sources
Other Literature Sources

