. 2019 May 6;9(1):6941.
doi: 10.1038/s41598-019-43497-9.

Immunohistochemical and ultrastructural analysis of the maturing larval zebrafish enteric nervous system reveals the formation of a neuropil pattern

Affiliations

Immunohistochemical and ultrastructural analysis of the maturing larval zebrafish enteric nervous system reveals the formation of a neuropil pattern

Phillip A Baker et al. Sci Rep. .

Abstract

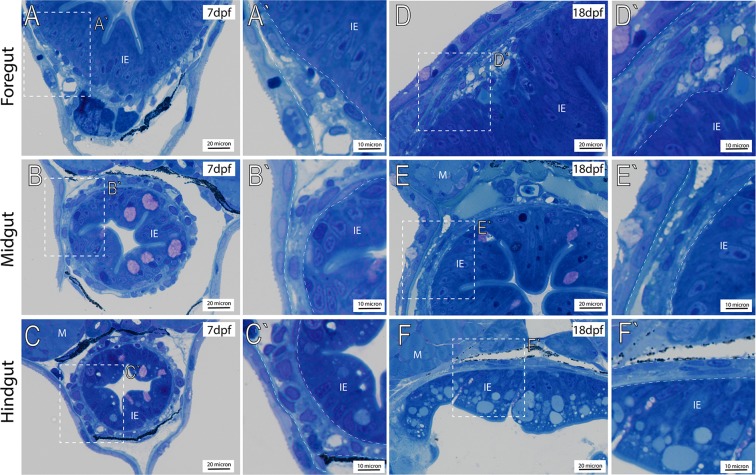
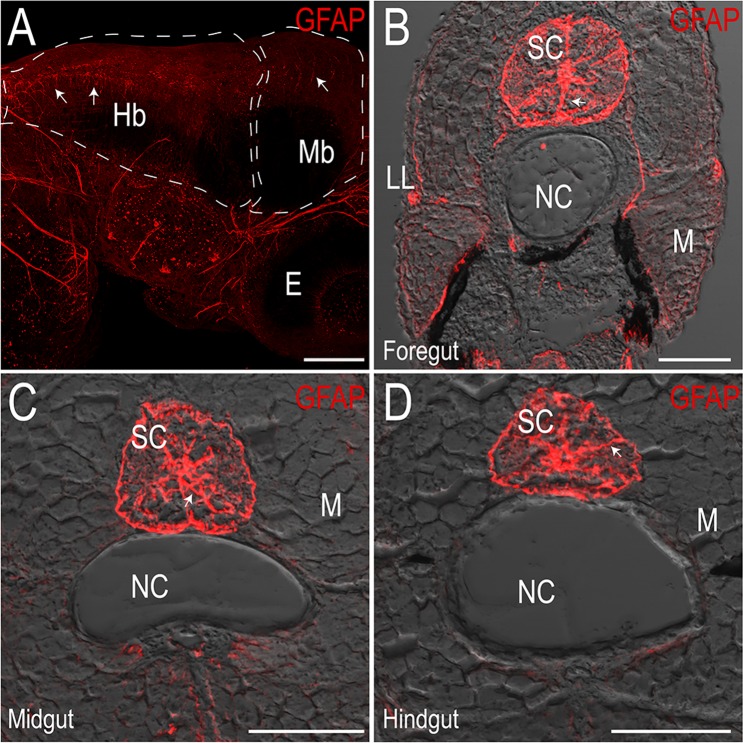
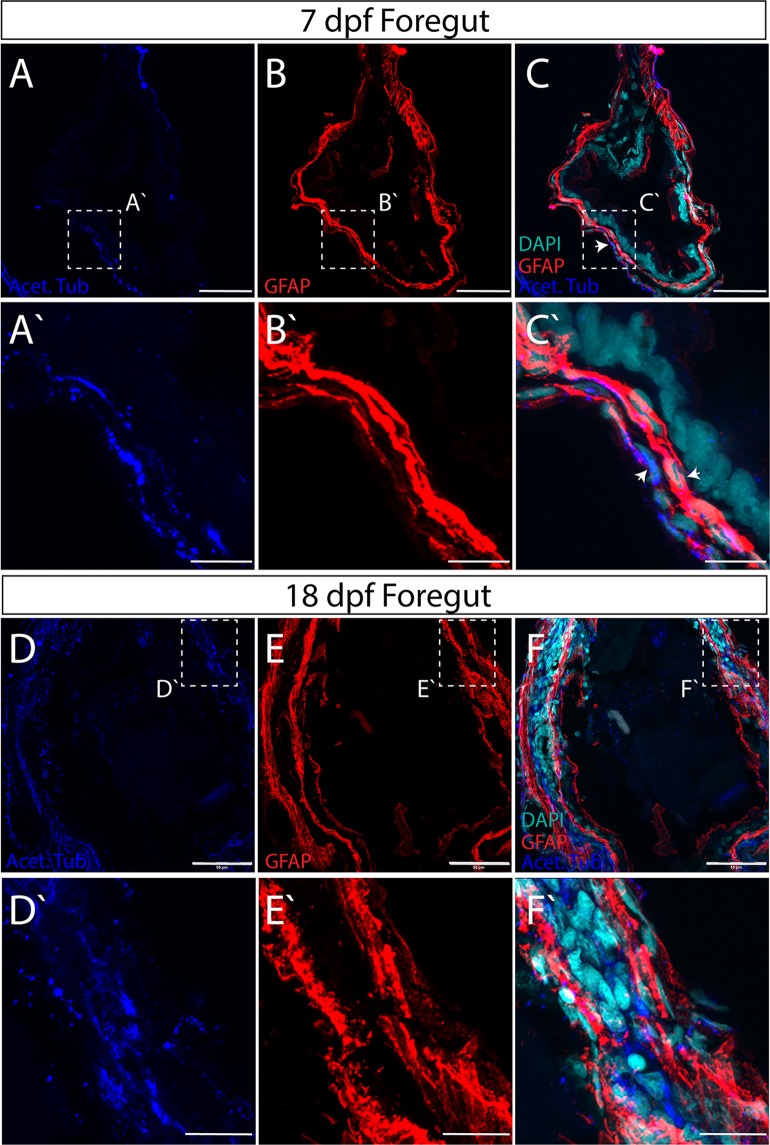
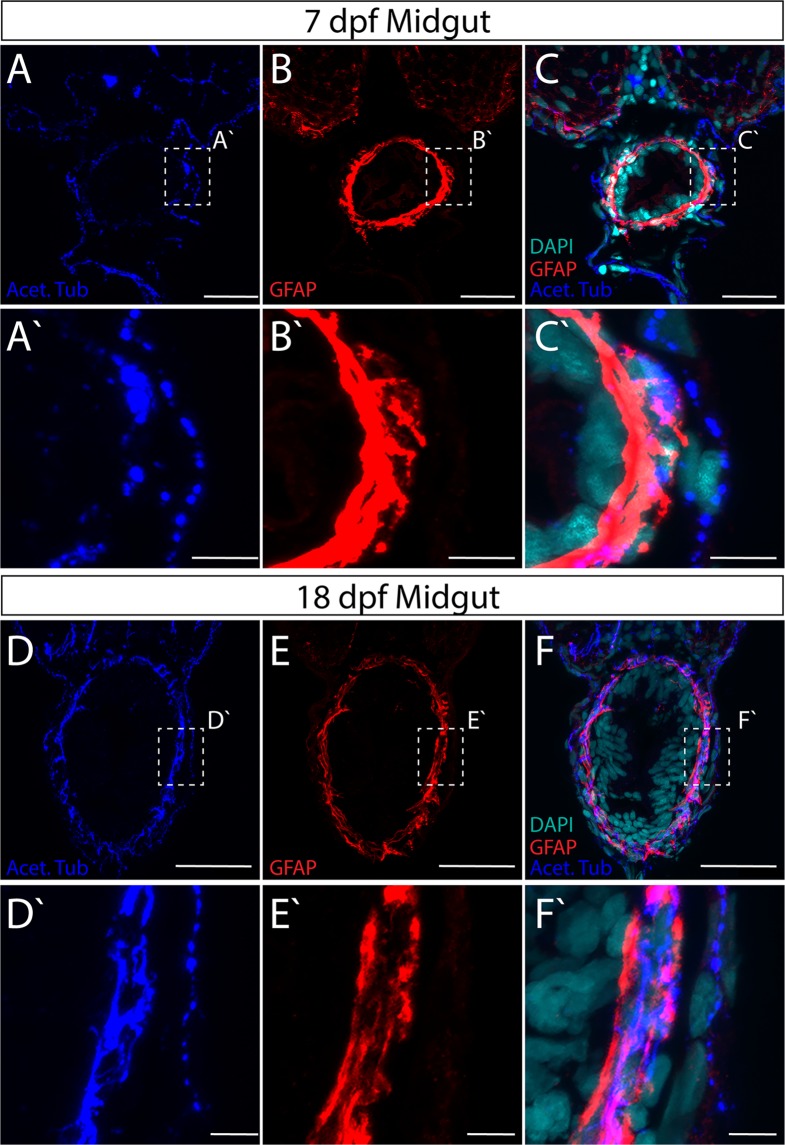
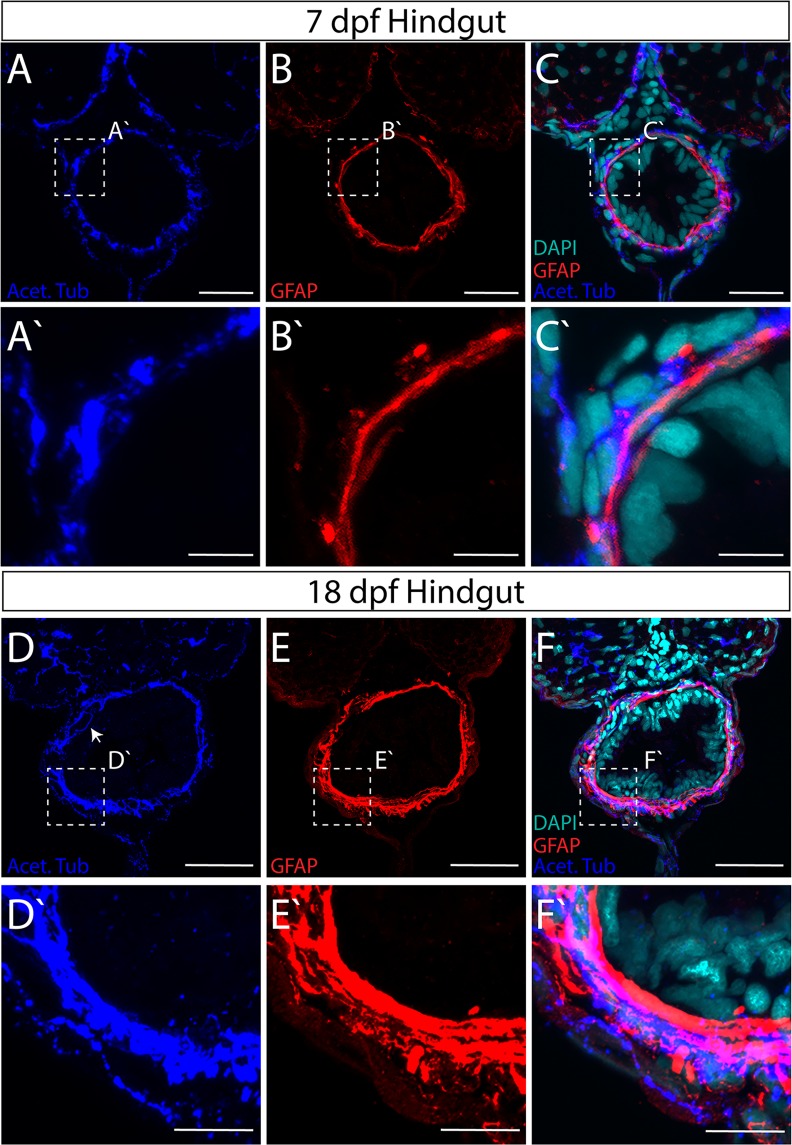
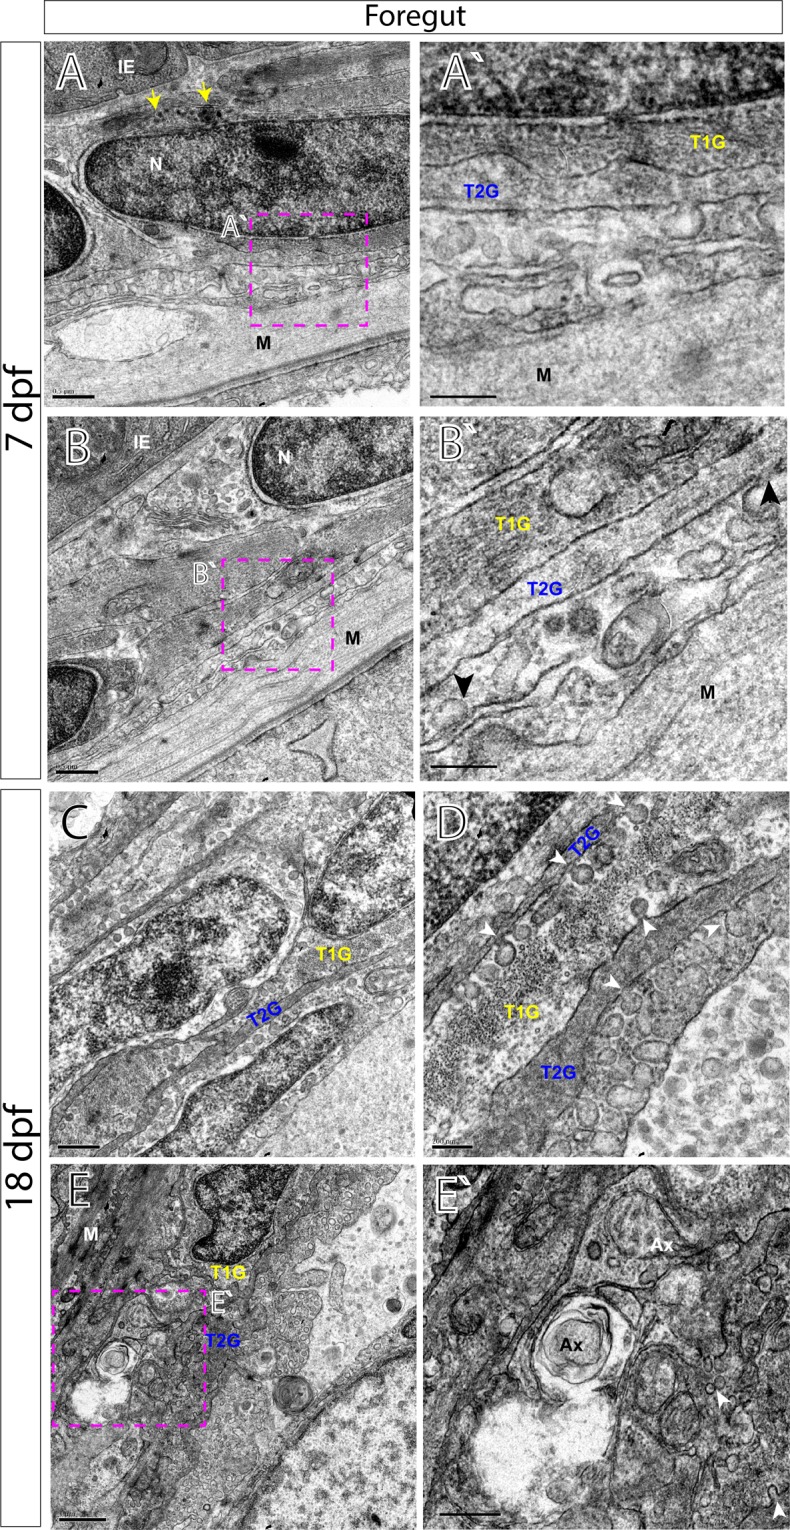
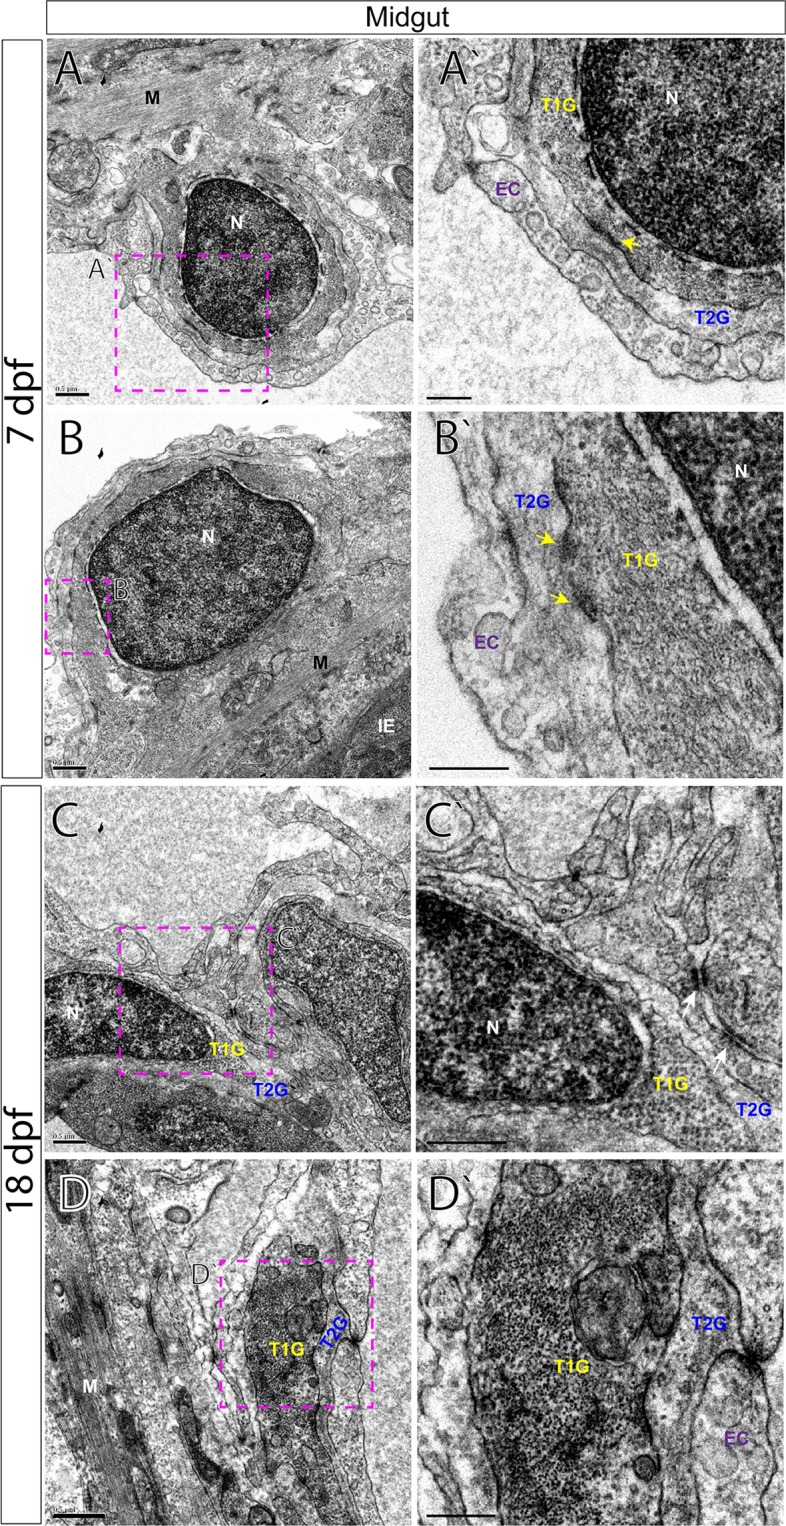
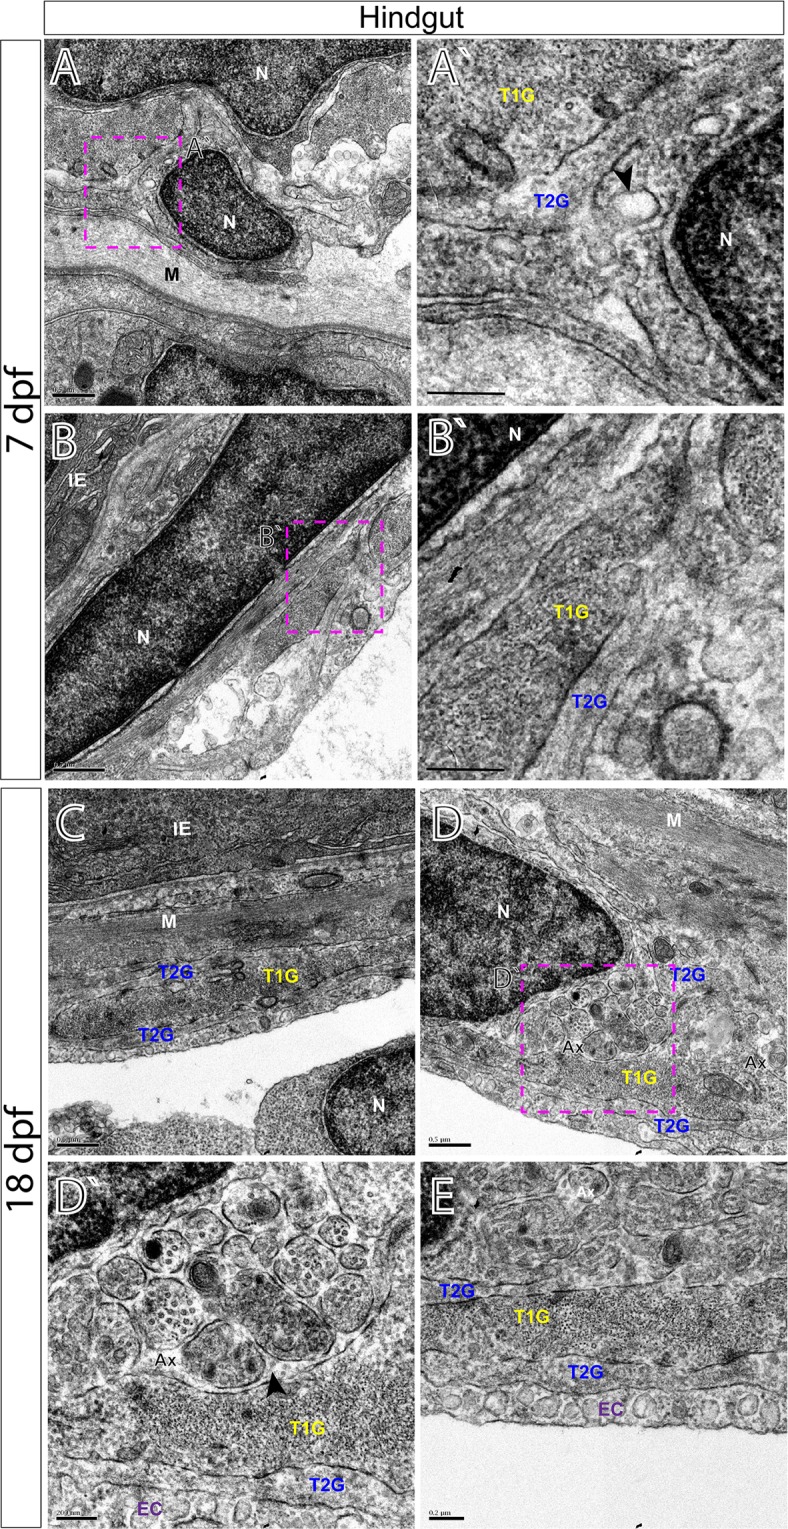
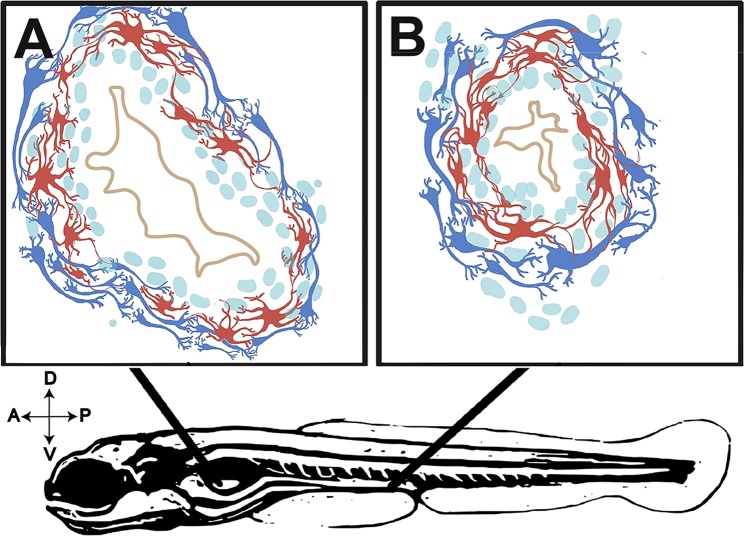
The gastrointestinal tract is constructed with an intrinsic series of interconnected ganglia that span its entire length, called the enteric nervous system (ENS). The ENS exerts critical local reflex control over many essential gut functions; including peristalsis, water balance, hormone secretions and intestinal barrier homeostasis. ENS ganglia exist as a collection of neurons and glia that are arranged in a series of plexuses throughout the gut: the myenteric plexus and submucosal plexus. While it is known that enteric ganglia are derived from a stem cell population called the neural crest, mechanisms that dictate final neuropil plexus organization remain obscure. Recently, the vertebrate animal, zebrafish, has emerged as a useful model to understand ENS development, however knowledge of its developing myenteric plexus architecture was unknown. Here, we examine myenteric plexus of the maturing zebrafish larval fish histologically over time and find that it consists of a series of tight axon layers and long glial cell processes that wrap the circumference of the gut tube to completely encapsulate it, along all levels of the gut. By late larval stages, complexity of the myenteric plexus increases such that a layer of axons is juxtaposed to concentric layers of glial cells. Ultrastructurally, glial cells contain glial filaments and make intimate contacts with one another in long, thread-like projections. Conserved indicators of vesicular axon profiles are readily abundant throughout the larval plexus neuropil. Together, these data extend our understanding of myenteric plexus architecture in maturing zebrafish, thereby enabling functional studies of its formation in the future.


Conflict of interest statement

The authors declare no competing interests.

Figures

Figure 1
Figure 1
Transverse histological sections depict general anatomy of intestinal muscularis. Plastic embedded fish sectioned transversely and stained with toluidine blue at (AC′) 7 dpf, and 18 dpf (DF′), reveals the intestinal epithelium (IE) situated below trunk muscle (M). White-dashed box (AF) corresponds to higher magnification panels (A′–F′) where intestinal muscularis is shown (dashed lines).
Figure 2
Figure 2
Zebrafish-specific Glial Fibrillary Acidic Protein (GFAP) antibody marks glia in the central nervous system. Maximum intensity projection confocal stack in (A) whole-mount immunofluorescence preparation of a 3 dpf larval fish showing GFAP+ cells in the hindbrain (Hb) and midbrain (Mb), scale bar: 100 microns, E: eye. (BD) Maximum intensity projections of transverse cryosections of 18 dpf larvae at the level of the foregut (B), midgut (C) and hindgut (D) mark radial glia throughout the spinal cord (SC). LL: lateral line, NC: notochord, M: skeletal trunk muscle, scale bar: 50 microns.
Figure 3
Figure 3
Axon and glial cell patterning within the myenteric plexus of the larval zebrafish foregut. Maximum intensity confocal projections of transverse cryosections indicate GFAP+ (red), Acetylated Tubulin+ (Acet-Tub) projections (blue) in the foregut of 7 dpf larvae (AC), where Acet-Tub+ processes form in an outer layer (white arrowheads), scale bar: 40 microns, (DF) 18 dpf larvae, scale bar: 50 microns. Nuclei revealed by DAPI (cyan). White-dashed box corresponds to region of magnification (A′–C′) scale bar: 10 microns, and (D′–F′) scale bar: 12.5 microns.
Figure 4
Figure 4
Axon and glial cell patterning within the myenteric plexus of the larval zebrafish midgut. Maximum intensity confocal projections of transverse cryosections indicate GFAP+ (red) and Acet-Tub+ projections (blue) in in the midgut of (AC) 7 dpf larvae, scale bar: 20 microns, and (DF) 18 dpf larvae, scale bar: 40 microns. Nuclei revealed by DAPI (cyan). White-dashed box corresponds to region of magnification (A′–C′) scale bar: 5 microns, and (D′–F′) scale bar: 5 microns.
Figure 5
Figure 5
Axon and glial cell patterning within the myenteric plexus of the larval zebrafish hindgut. Maximum intensity confocal projections of transverse cryosections indicate GFAP+ (red) and Acet-Tub+ projections (blue) in the hindgut of (AC) 7 dpf larvae, scale bar: 20 microns, and (DF) 18 dpf larvae with axon projecting close to IE (arrow), scale bar: 40 microns. Nuclei revealed by DAPI (cyan). White-dashed box corresponds to region of magnification (A′–C′) scale bar: 5 microns, and (D′–F′) scale bar: 5 microns.
Figure 6
Figure 6
Transmission electron microscopy (TEM) characterizes glial cells and axon ultrastructure within the larval zebrafish foregut. TEM reveals ultrastructure of myenteric plexus neuropil of the foregut in (A,B′) 7 dpf and (CE′) 18 dpf larvae. Magenta-dashed box corresponds to region of magnification (A′–E′). Intestinal epithelium (IE), nucleus (N), nuclear body (NB), muscularis (M), axon (Ax), type 1 glia (T1G) and type 2 glia (T2G). Scale bars denote the following: (A) 500 nm, (A′) 250 nm, (B) 500 nm, (B′) 250 nm, (C) 500 nm, (D) 200 nm, (E) 1 micron and (E′) 500 nm. Yellow arrows in (A) point to large granular vesicles, black arrowheads in (B′) and white arrowheads in (D,E′) point to caveolae.
Figure 7
Figure 7
TEM characterizes glial cells and axon ultrastructure within the larval zebrafish midgut. TEM reveals ultrastructure of myenteric plexus neuropil of the midgut in (A,B′) 7 dpf and (C,D′) 18 dpf larvae. Magenta-dashed box corresponds to region of magnification (A′–D′). Intestinal epithelium (IE), nucleus (N), muscularis (M), endothelial cell (EC), type 1 glial (T1G) and type 2 glia (T2G). Scale bars denote the following: (A) 500 nm, (A′) 250 nm, (B) 500 nm, (B′) 250 nm, (C) 500 nm, (C′) 250 nm, (D) 500 nm, (D′) 250 nm. Yellow arrows in (A′,B′) and white arrows in (C′) point to electron dense junctions between T1G and T2G.
Figure 8
Figure 8
TEM characterizes glial cells and ultrastructure within the larval zebrafish hindgut. TEM reveals ultrastructure of myenteric plexus neuropil of the hindgut in (A,B′) 7 dpf and (CE) 18 dpf larvae. Magenta-dashed box corresponds to region of magnification (A′–D′). Intestinal epithelium (IE), nucleus (N), muscularis (M), axon (Ax), endothelial cell (EC), type 1 glial (T1G) and type 2 glia (T2G). Scale bars denote the following: (A) 500 nm, (A′) 250 nm, (B) 500 nm, (B′) 250 nm, (C) 500 nm, (D) 500 nm, (D′) 200 nm and (E) 200 nm. Black arrowhead in (A′) points to caveolae and to axon bundles in (D′).
Figure 9
Figure 9
Illustrative representation of ENS myenteric plexus structure in the maturing larval zebrafish. Representative illustrations of (A,B) immunohistochemical preparations of 7 dpf larval foregut and hindgut depicting glia (red) and neurons (blue) of the myenteric plexus. Not to scale.

References

    1. Furness, J. B. & Wiley InterScience (Online service). The enteric nervous system. (Blackwell Pub, 2006).
    1. Le Douarin, N. M. & Teillet, M. -A. The migration of neural crest cells to the wall of the digestive tract in avian embryo. Development30, (1973). - PubMed
    1. Epstein ML, Mikawa T, Brown AMC, McFarlin DR. Mapping the origin of the avian enteric nervous system with a retroviral marker. Dev. Dyn. 1994;201:236–244. doi: 10.1002/aja.1002010307. - DOI - PubMed
    1. Kuo BR, Erickson CA. Vagal neural crest cell migratory behavior: A transition between the cranial and trunk crest. Dev. Dyn. 2011;240:2084–2100. doi: 10.1002/dvdy.22715. - DOI - PMC - PubMed
    1. Shepherd IT, Pietsch J, Elworthy S, Kelsh RN, Raible DW. Roles for GFRalpha1 receptors in zebrafish enteric nervous system development. Development. 2004;131:241–9. doi: 10.1242/dev.00912. - DOI - PubMed

Publication types

LinkOut - more resources