. 2019 Jun;37(6):685-691.
doi: 10.1038/s41587-019-0113-3. Epub 2019 May 6.

Efficient integration of heterogeneous single-cell transcriptomes using Scanorama

Affiliations

Efficient integration of heterogeneous single-cell transcriptomes using Scanorama

Brian Hie et al. Nat Biotechnol. 2019 Jun.

Abstract

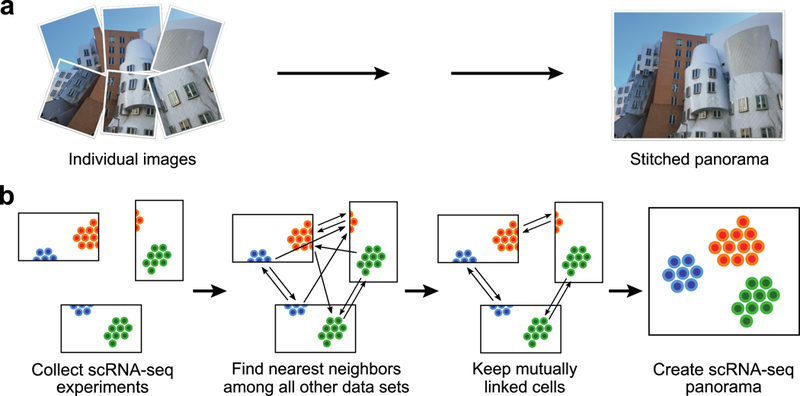
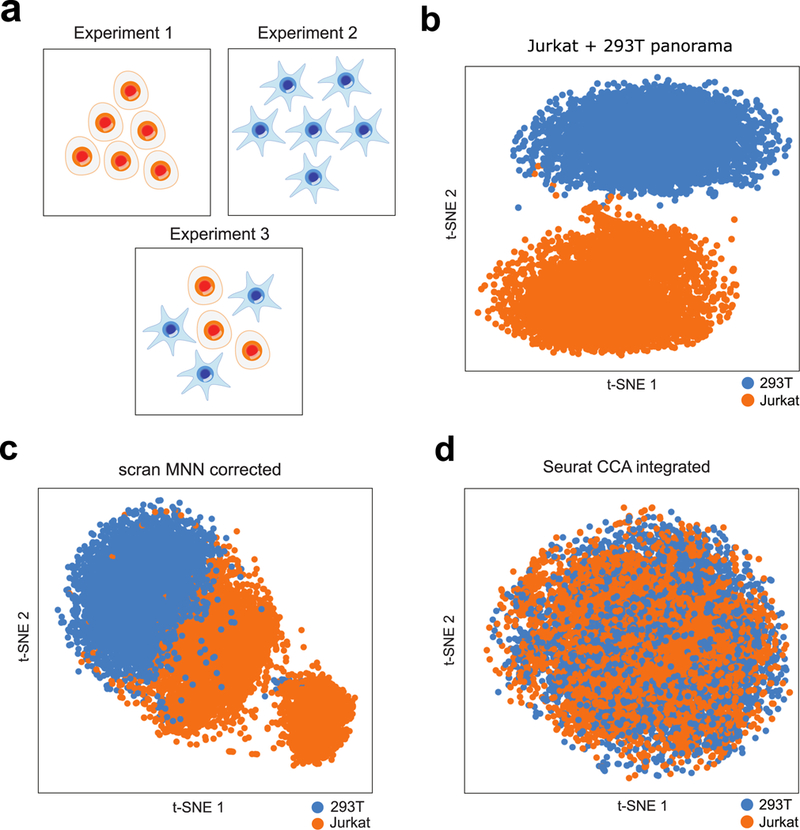
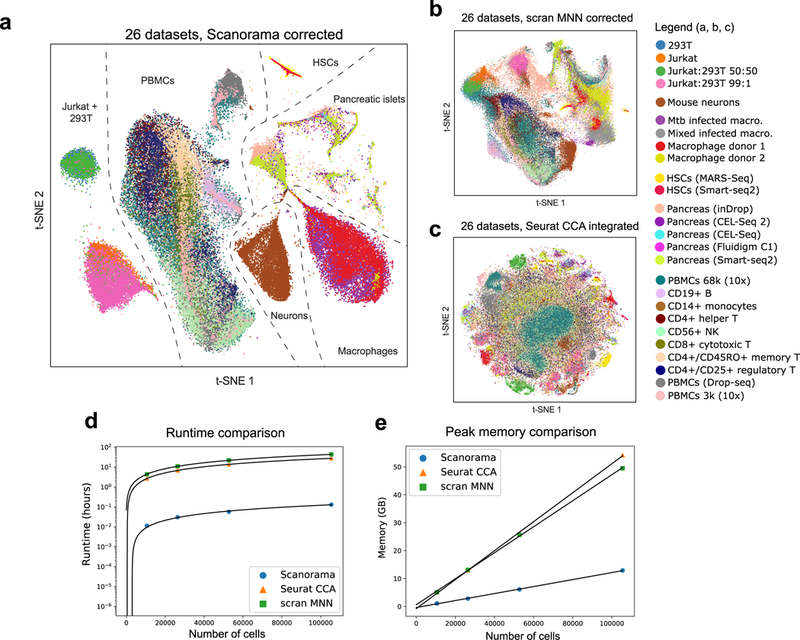
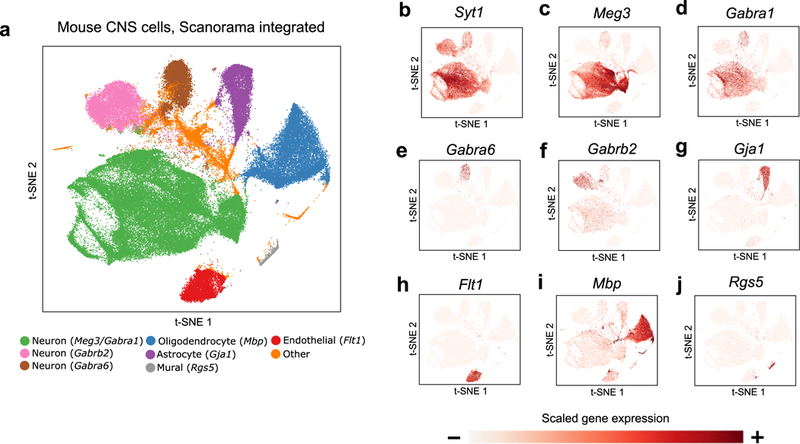
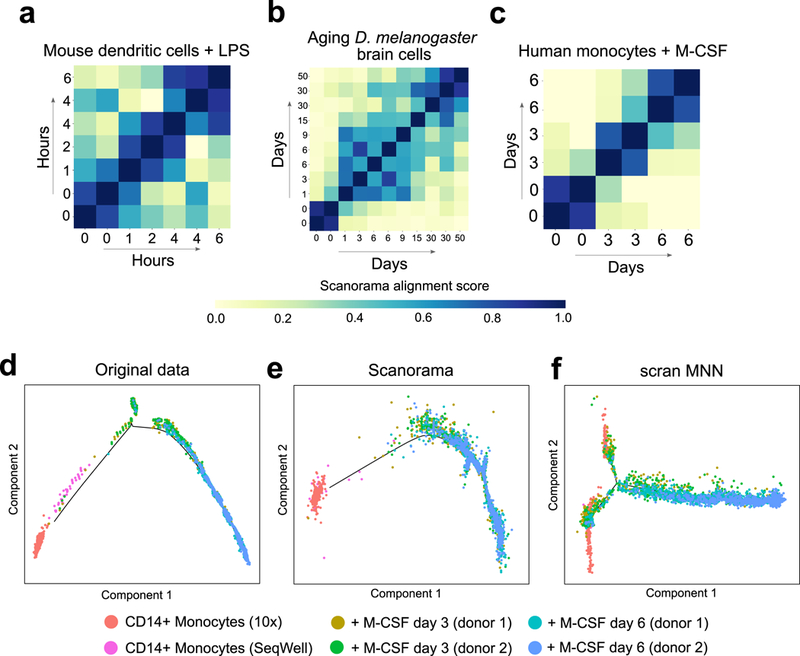
Integration of single-cell RNA sequencing (scRNA-seq) data from multiple experiments, laboratories and technologies can uncover biological insights, but current methods for scRNA-seq data integration are limited by a requirement for datasets to derive from functionally similar cells. We present Scanorama, an algorithm that identifies and merges the shared cell types among all pairs of datasets and accurately integrates heterogeneous collections of scRNA-seq data. We applied Scanorama to integrate and remove batch effects across 105,476 cells from 26 diverse scRNA-seq experiments representing 9 different technologies. Scanorama is sensitive to subtle temporal changes within the same cell lineage, successfully integrating functionally similar cells across time series data of CD14+ monocytes at different stages of differentiation into macrophages. Finally, we show that Scanorama is orders of magnitude faster than existing techniques and can integrate a collection of 1,095,538 cells in just ~9 h.


Figures

Figure 1
Figure 1
Illustration of “panoramic” dataset integration. (a) A panorama stitching algorithm finds and merges overlapping images to create a larger, combined image. (b) A similar strategy can also be used to merge heterogeneous scRNA-seq datasets. Scanorama searches nearest neighbors to identify shared cell types among all pairs of datasets. Dimensionality reduction techniques and an approximate nearest neighbors algorithm based on hyperplane locality sensitive hashing and random projection trees greatly accelerate the search step. Mutually linked cells form matches that can be leveraged to correct for batch effects and merge experiments together (Methods), where the datasets forming connected components based on these matches become a scRNA-seq “panorama.”
Figure 2
Figure 2
Scanorama correctly integrates a simple collection of datasets where other methods fail. (a) We apply Scanorama to a collection of three datasets: one entirely of Jurkat cells (n = 3257 cells) (Experiment 1), one entirely of 293T cells (n = 2885 cells) (Experiment 2), and a 50:50 mixture of Jurkat and 293T cells (n = 3388 cells) (Experiment 3). (b) Our method correctly identifies Jurkat cells (orange) and 293T cells (blue) as two separate clusters. (c,d) Existing methods for scRNA-seq dataset integration are sensitive to the order in which they consider datasets (see Supplementary Fig. 1) and can incorrectly merge a Jurkat dataset and a 293T dataset together first before subsequently incorporating a 293T/Jurkat mixture, forming clusters that do not correspond to actual cell types.
Figure 3
Figure 3
Panoramic integration of 26 single cell datasets across 9 different technologies. (a) t-SNE visualization of 105,476 cells after batch-correction by our method, with cells clustering by cell type instead of by batch (median Silhouette Coefficient of 0.17). (b, c) Other methods for scRNA-seq dataset integration (scran MNN and Seurat CCA) are not designed for heterogeneous dataset integration and therefore naively merge all datasets into a single large cluster (median Silhouette Coefficient of −0.03 for scran MNN and −0.18 for Seurat CCA; Supplementary Fig. 10). (d, e) Scanorama integrates 105,476 cells across 26 datasets in less than 6 minutes and in under 12 GB of RAM, which is substantially more efficient than current methods for scRNA-seq integration.
Figure 4
Figure 4
Scanorama scales to collections of data sets with more than a million cells. (a) Scanorama integrates a collection of 1,095,538 cells from the mouse brain and spinal cord. (b-j) Marker gene expression reveals cell type-specific clusters including (b-f) Syt1, Meg3, Gabra1, Gabra6, and Gabrb2 in neurons, (g) Gja1 in astrocytes, (h) Flt1 in endothelial cells, (i) Mbp in oligodendrocytes, and (j) Rgs5 in mural cells.
Figure 5
Figure 5
Scanorama is sensitive to subtle transcriptional changes in cellular state over time. (a-c) Heatmap rows and columns correspond to different datasets within the time course study (including replicate datasets at the same timepoint) and diagonal entries are set to 1. Higher alignment scores (darker blue) tend to be close to the diagonal, indicating greater transcriptional similarity between datasets from closer time points. The temporal differences and the alignment scores are significantly correlated in each time series experiment: Spearman correlation of (a) −0.60 (P = 0.0043, n = 42 pairs of time points) for mouse dendritic cells with LPS, (b) −0.49 (P = 1.3e-4, n = 110 pairs of time points) for aging D. melanogaster brain cells, and (c) −0.88 (P = 1.8e-5, n = 30 pairs of timepoints) for monocytes with M-CSF stimulation. (d-f) Scanorama removes batch effects separating CD14+ monocytes obtained by different technologies when visualized according to pseudo-time assigned by the Monocle 2 algorithm. Due to overcorrection, Monocle 2 can no longer identify the main differentiation trajectory after batch correction with scran MNN.

References

    1. Grün D et al. Single-cell messenger RNA sequencing reveals rare intestinal cell types. Nature 525, 251–255 (2015). - PubMed
    1. Villani A-C et al. Single-cell RNA-seq reveals new types of human blood dendritic cells, monocytes, and progenitors. Science. 356, eaah4573 (2017). - PMC - PubMed
    1. Trapnell C et al. The dynamics and regulators of cell fate decisions are revealed by pseudotemporal ordering of single cells. Nat. Biotechnol. 32, 381–386 (2014). - PMC - PubMed
    1. Treutlein B et al. Reconstructing lineage hierarchies of the distal lung epithelium using singlecell RNA-seq. Nature 509, 371–375 (2014). - PMC - PubMed
    1. Aibar S et al. SCENIC: Single-cell regulatory network inference and clustering. Nat. Methods 14, 1083–1086 (2017). - PMC - PubMed

Methods Only References

    1. Oliphant TE SciPy: Open source scientific tools for Python. Comput. Sci. Eng. 9, 10–20 (2007).
    1. Loh PR, Baym M & Berger B Compressive genomics. Nature Biotechnology 30, 627–630 (2012). - PubMed
    1. Van Der Maaten LJP & Hinton GE Visualizing high-dimensional data using t-SNE.J. Mach. Learn. Res. 9, 2579–2605 (2008).
    1. Pedregosa F & Varoquaux G Scikit-learn: Machine learning in Python. Journal of Machine Learning Research 12 (2011).
    1. Buttner M, Miao Z, Wolf A, Teichmann SA & Theis FJ A test metric for assessing single-cell RNA-seq batch correction. Nat. Methods 16, 43–49 (2017). - PubMed

Publication types

MeSH terms