. 2019 May 6;9(1):6921.
doi: 10.1038/s41598-019-43393-2.

Multi-segment rupture of the 2016 Amatrice-Visso-Norcia seismic sequence (central Italy) constrained by the first high-quality catalog of Early Aftershocks

Collaborators, Affiliations

Multi-segment rupture of the 2016 Amatrice-Visso-Norcia seismic sequence (central Italy) constrained by the first high-quality catalog of Early Aftershocks

Luigi Improta et al. Sci Rep. .

Abstract

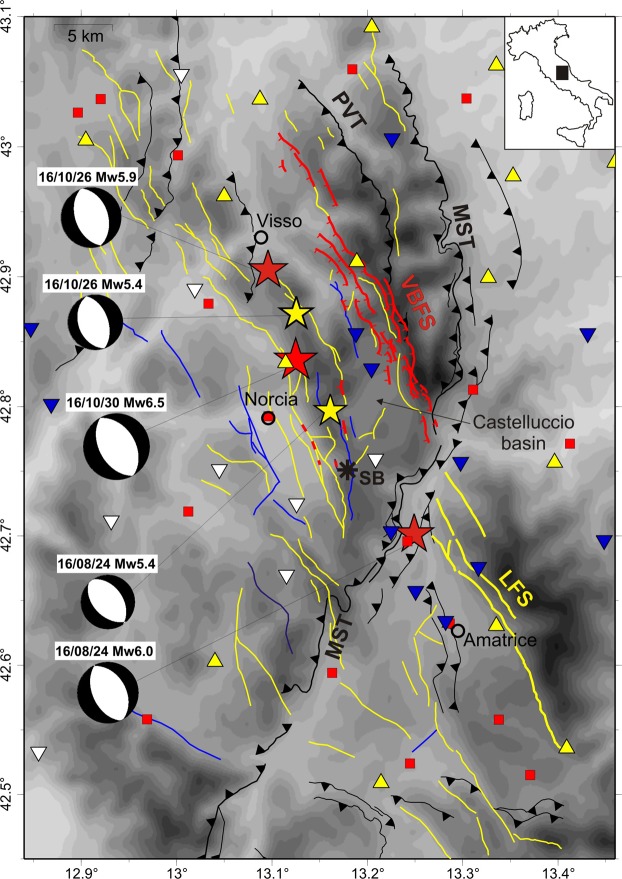
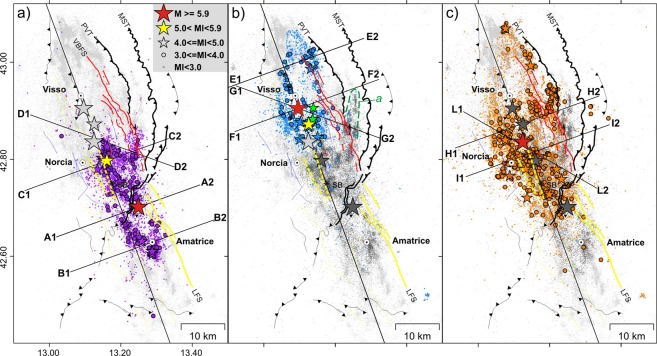
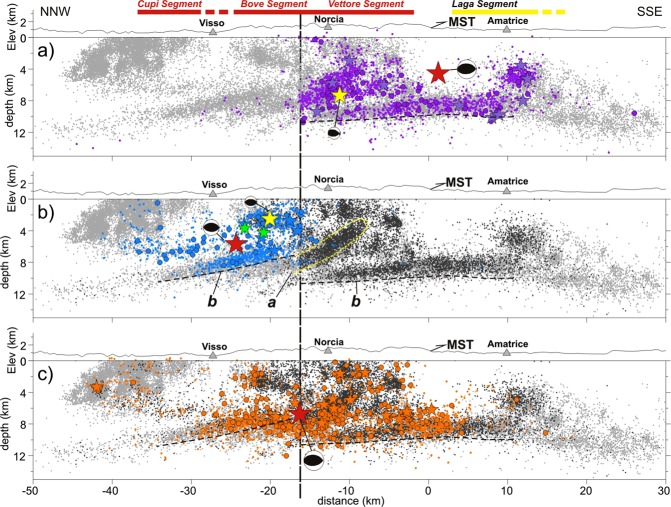
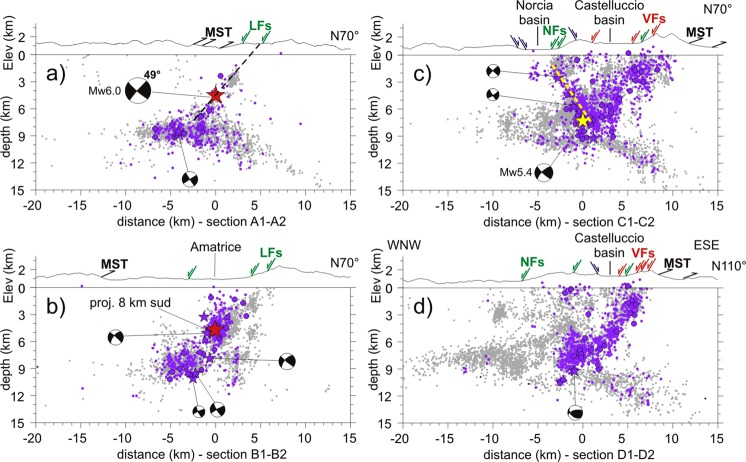
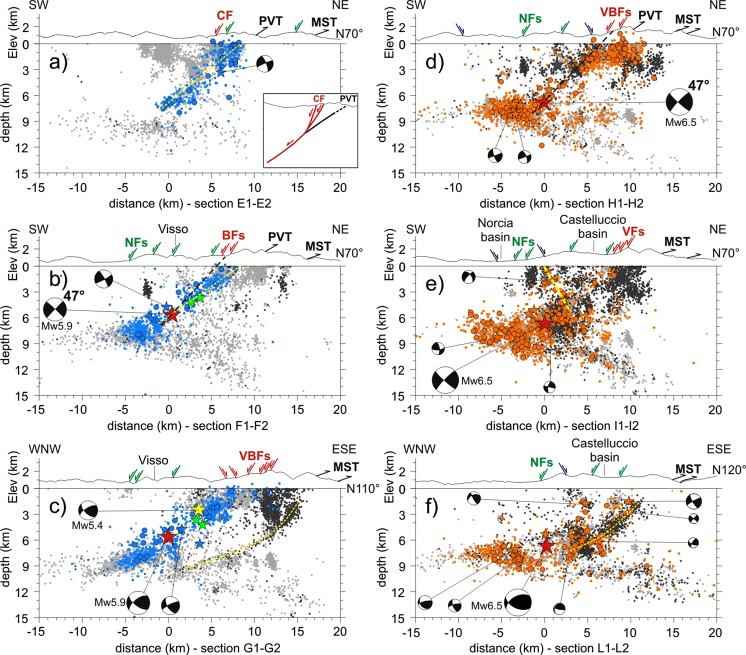
We present the first high-quality catalog of early aftershocks of the three mainshocks of the 2016 central Italy Amatrice-Visso-Norcia normal faulting sequence. We located 10,574 manually picked aftershocks with a robust probabilistic, non-linear method achieving a significant improvement in the solution accuracy and magnitude completeness with respect to previous studies. Aftershock distribution and relocated mainshocks give insight into the complex architecture of major causative and subsidiary faults, thus providing crucial constraints on multi-segment rupture models. We document reactivation and kinematic inversion of a WNW-dipping listric structure, referable to the inherited Mts Sibillini Thrust (MST) that controlled segmentation of the causative normal faults. Spatial partitioning of aftershocks evidences that the MST lateral ramp had a dual control on rupture propagation, behaving as a barrier for the Amatrice and Visso mainshocks, and later as an asperity for the Norcia mainshock. We hypothesize that the Visso mainshock re-activated also the deep part of an optimally oriented preexisting thrust. Aftershock patterns reveal that the Amatrice Mw5.4 aftershock and the Norcia mainshock ruptured two distinct antithetic faults 3-4 km apart. Therefore, our results suggest to consider both the MST cross structure and the subsidiary antithetic fault in the finite-fault source modelling of the Norcia earthquake.


Conflict of interest statement

The authors declare no competing interests.

Figures

Figure 1
Figure 1
Map of the epicentral area showing main active normal faults. Yellow lines denote W-dipping fault, blue lines E-dipping faults, yellow solid lines the Laga Fault system (LFS), red solid lines co-seismic surface ruptures along the Vettore-Bove fault system (VBFS) (modified after). The black barbed lines are Miocene-Pliocene thrusts (MST: Mts Sibillini Thrust; PVT: Pizzo Tre Vescovi thrust). Red stars denote the three mainshocks and yellow stars M5+ events, with associated TDMT focal mechanisms (http://cnt.rm.ingv.it/tdmt). Yellow triangles are stations of the INGV National Seismic Network, blue triangles real-time temporary stations, white triangles temporary stations used for the first time in this study. Red squares denote DPC accelerometric stations used to re-locate the mainshocks and M5+ events. Black asterisk (label SB) indicates the coseismic faulting that affected the San Benedetto freeway tunnel.
Figure 2
Figure 2
Map view of the relocated aftershocks. (a) Early aftershocks of the Amatrice earthquake (purple, August 24–26), (b) of the Visso earthquake (cyan, October 26–27) and (c) of the Norcia earthquake (orange, October 30–November 1). Grey dots are late aftershocks analyzed routinely in quasi real-time at the INGV surveillance center and relocated in this study (light and dark grey dots denote earthquakes occurred after and before the time interval considered in each panel, respectively). Colored lines are fault traces, with main faults ruptured during the seismic sequence evidenced by thick lines (fault symbols as in Fig. 1). Red solid lines correspond to co-seismic surface ruptures along the Vettore-Bove fault system (VBFS). Dashed thick yellow lines denote the up-dip projection (top at sea level) of the two antithetic normal faults defined in this study, ruptured by the Amatrice Mw5.4 aftershock (western fault) and the Norcia mainshock (eastern fault). Dashed green line in panel (b) delimits the aftershock cloud elongated N-S parallel to the MST frontal ramp (outlined by label a). Black asterisk (label SB) indicates the coseismic faulting that affected the San Benedetto freeway tunnel.
Figure 3
Figure 3
Aftershocks projected onto the N160°-oriented section showed in Fig. 2. (a) Aftershocks of the Amatrice earthquake, (b) of the Visso earthquake and (c) of the Norcia earthquake (symbols as in Fig. 2a–c). Hypocenters within 5 km distance from section are projected. Fault segments ruptured by the mainshocks are schematically reported on top of panel (a). The yellow dashed line (label a) outlines the WNW-dipping cloud of aftershocks of the Amatrice and Norcia earthquakes that relates to the MST lateral ramp. The black dashed lines define the bottom of the deep band of high aftershock production (label b).
Figure 4
Figure 4
Early aftershocks of the Amatrice earthquake projected onto sections oriented orthogonal to the Laga Fault system (a,b), Vettore Fault (c) and Mts Sibillini Thrust (d). Light grey dots are aftershocks occurred after the considered time interval (24–26 August). Focal mechanisms are projected TDMT solutions of M > 4 events. The dashed yellow lines define fault planes delineated by aftershock alignments, the black dashed lines mainshock fault planes inferred by TDMT solutions. Hypocenters within 3 km distance from sections are projected. Red arrows outline surface rupturing segments of the Vettore Fault (VFs), green arrows W-dipping active normal faults (LFs - Laga Fault system, NFs - Norcia basin fault-system), blue arrow NE-dipping active normal faults, black arrows traces of the Mts Sibillini Thrust (MST).
Figure 5
Figure 5
Early aftershocks of the Visso earthquake and Norcia earthquakes are projected onto sections oriented orthogonal to the Vettore-Bove fault system (a,b and d,e, respectively) and Mts Sibillini Thrust (c,f, respectively). Light and dark grey dots denote earthquakes occurred after and before the time interval considered in each panel, respectively. Focal mechanisms are projected TDMT solutions of M > 4 events. The dashed yellow lines define fault planes delineated by aftershock alignments, the black dashed lines mainshock fault planes inferred by TDMT solutions. Hypocenters within 3 km distance from sections are projected, with the exception of section L1-L2 in panel (f) for which events are within 1.5 km distance. Red arrows outline surface rupturing segments of the of the Vettore-Bove fault system (VFs - Vettore Fault, BF - Bove fault, CF - Cupi Fault), green arrows W-dipping active normal faults (NFs - Norcia basin fault-system), blue arrow NE-dipping active normal faults, black arrows inherited thrusts (MST - Mts Sibillini Thrust, PVT - Pizzo Tre Vescovi thrust). The inset sketch of panel a illustrates the model hypothesized for the northern segment ruptured by the Visso earthquake (red lines define ruptured segments, the black line the shallow part of the Pizzo Tre Vescovi thrust prolific in off-fault aftershock production).

References

    1. Scholz, C. H. The mechanics of earthquakes and faulting. Cambridge University Press, 10.1017/CBO9780511818516 (2002).
    1. Wesnousky SG. Displacement and geometrical characteristics of earthquake surface ruptures - Issues and implications for seismic-hazard analysis and the process of earthquake rupture. Bull. Seism. Soc. Am. 2008;98(4):1609–1632. doi: 10.1785/0120070111. - DOI
    1. Fletcher JM, Oskin ME, Teran OJ. The role of a keystone fault in triggering the complex El Mayor–Cucapah earthquake rupture. Nature Geoscience. 2016;9:303–307. doi: 10.1038/ngeo2660. - DOI
    1. Xu W, et al. Transpressional rupture cascade of the 2016 Mw 7.8 Kaikoura earthquake, New Zealand. J. Geophys. Res. - Solid Earth. 2018;123:2396–2409. doi: 10.1002/2017JB015168. - DOI
    1. Kato A, et al. Imaging the source regions of normal faulting sequences induced by the 2011 M9.0 Tohoku-Oki. Geophys. Res. Lett. 2013;40:273–278. doi: 10.1002/grl.50104. - DOI