. 2019 Mar 4;10(4):1581-1600.
doi: 10.1364/BOE.10.001581. eCollection 2019 Apr 1.

Raman spectrum spectral imaging revealing the molecular mechanism of Berberine-induced Jurkat cell apoptosis and the receptor-mediated Berberine delivery system

Affiliations

Raman spectrum spectral imaging revealing the molecular mechanism of Berberine-induced Jurkat cell apoptosis and the receptor-mediated Berberine delivery system

Ping Tang et al. Biomed Opt Express. .

Abstract

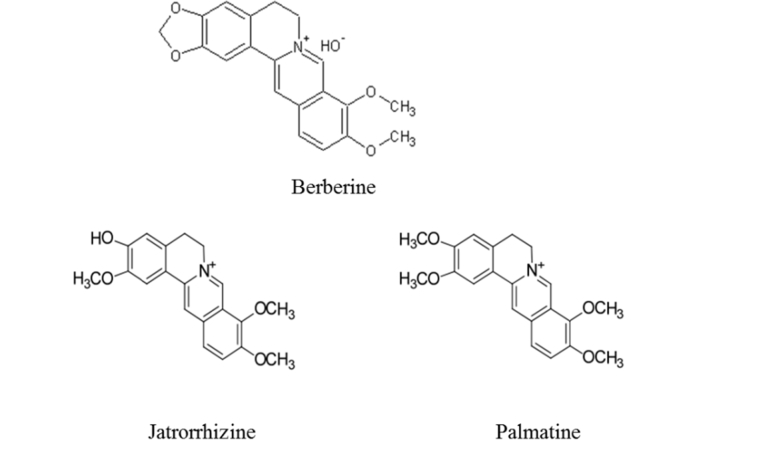
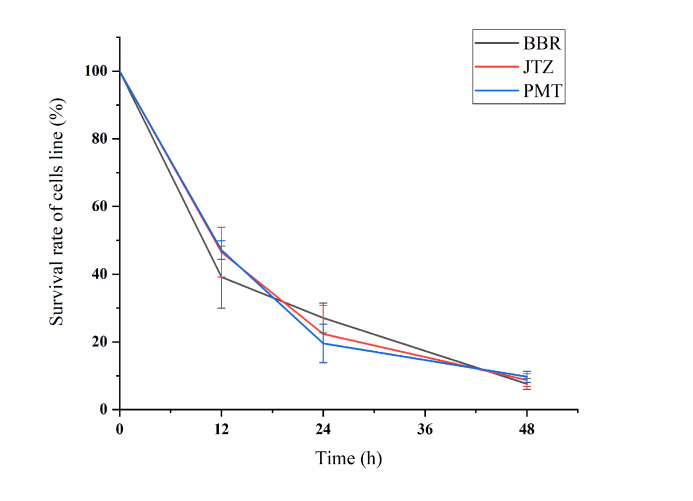
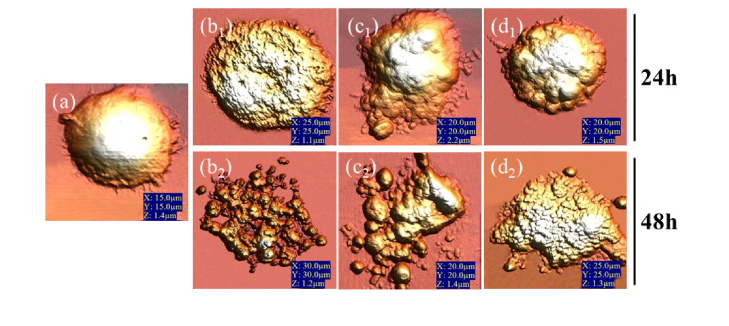
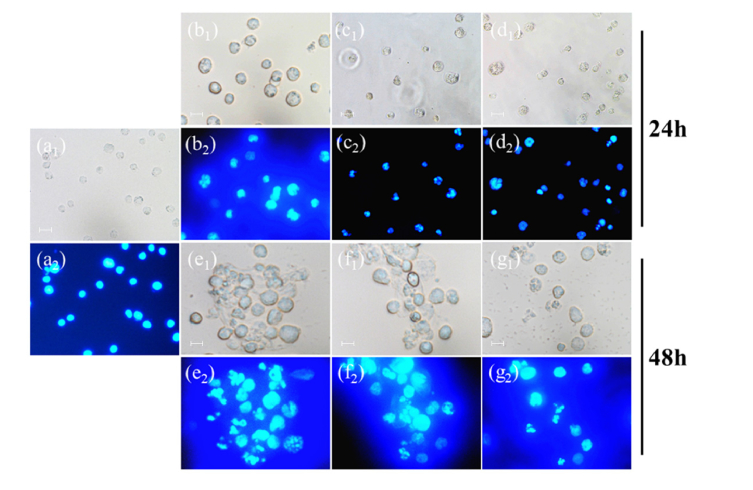
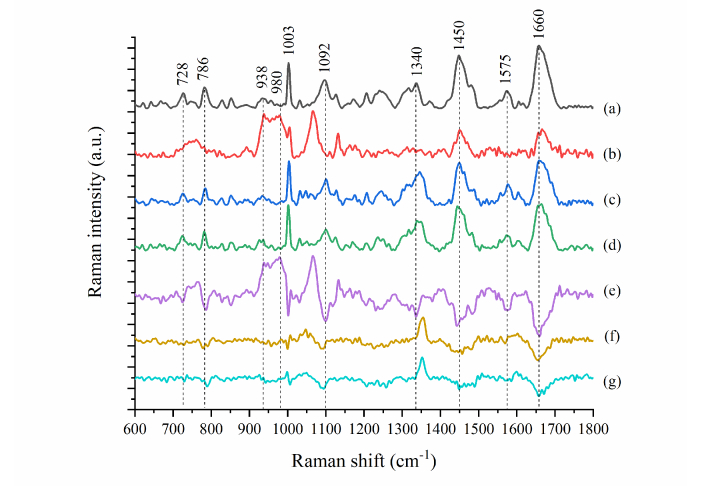
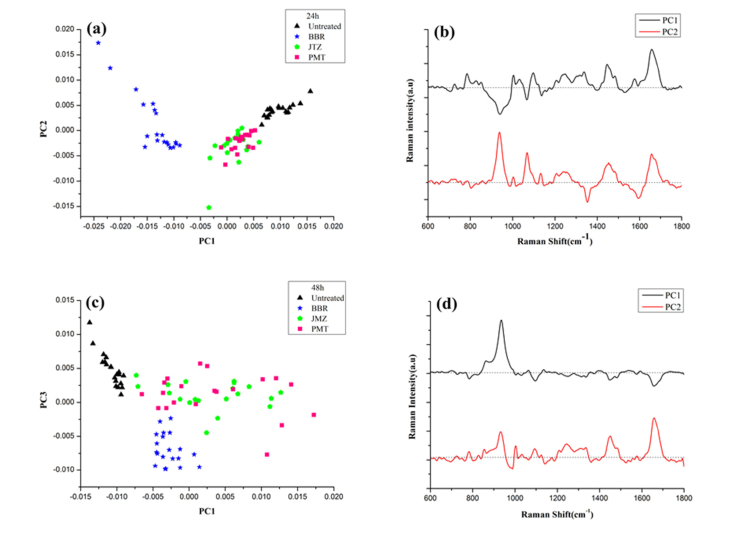
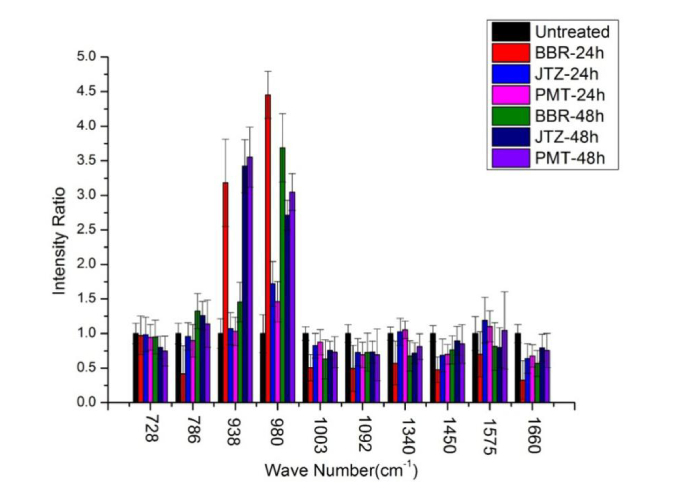
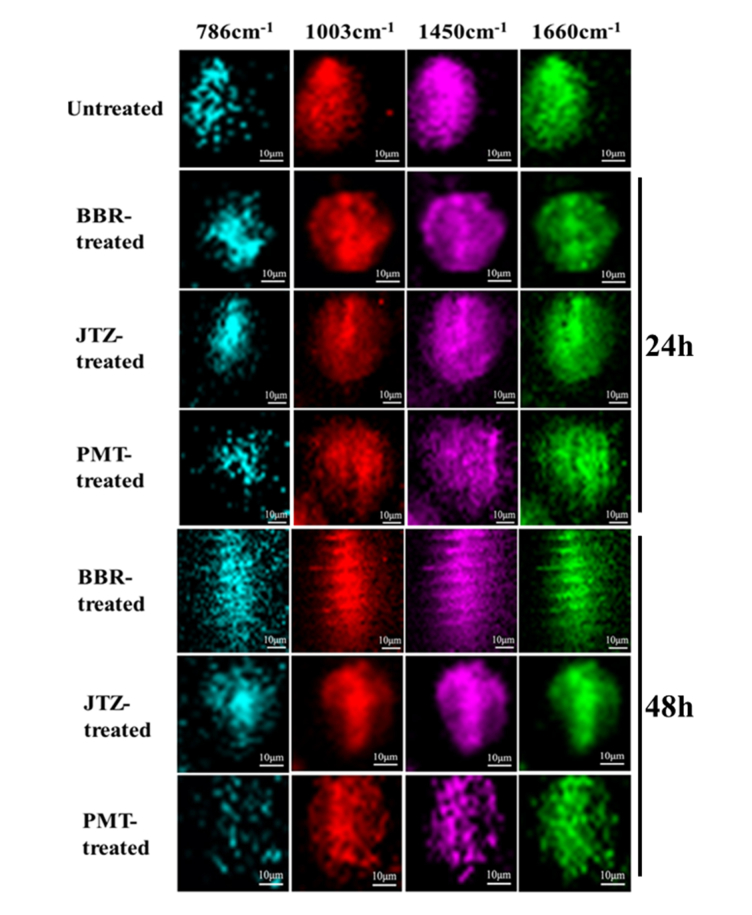
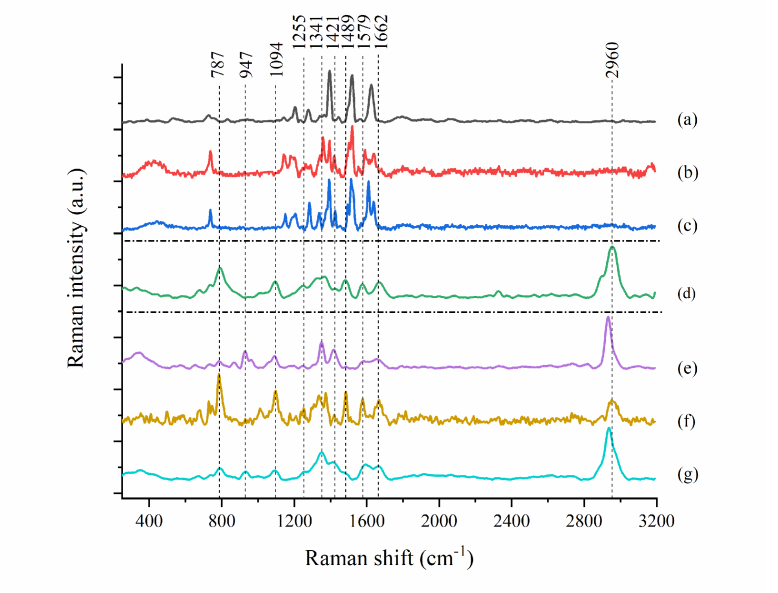
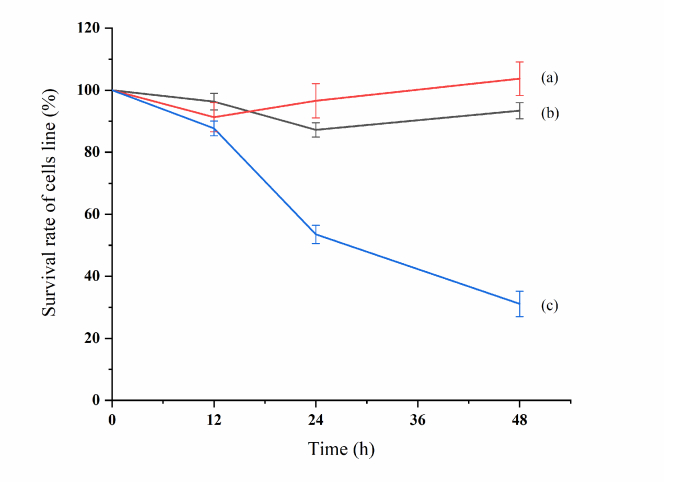
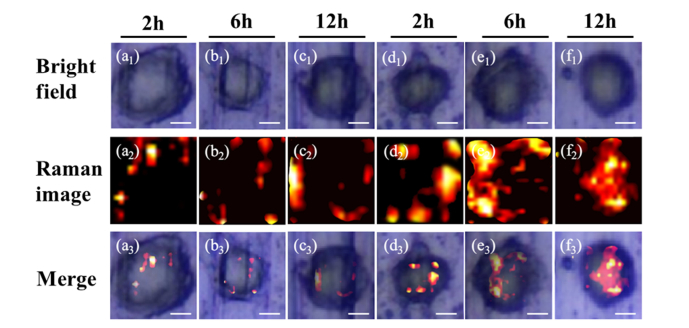
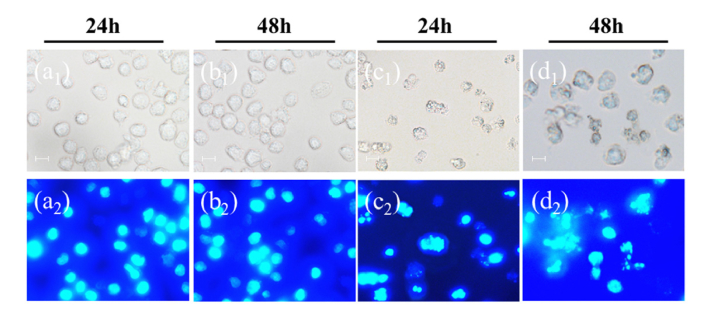
Berberine (BBR), a traditional Chinese herb extract medicine, reveals some anticancer effects in leukemia, but it remains controversial about the molecular mechanism of BBR-induced leukemia cell apoptosis. In this study, combining Raman spectrum and spectral imaging, both the biochemical changes of BBR-induced Jurkat cell apoptosis and the precise distribution of BBR in single cell are presented. In contrast, we also show the corresponding results of Jatrorrhizine (JTZ) and Palmatine (PMT), two structural analogues of BBR. It is found that all three structural analogues can induce cell apoptosis by breaking DNA and the main action sites are located in phosphate backbone and base pair groups, but their action on cell cycle are different, in which BBR leads to the S phase arrest while JTZ and PMT are on the G2 phase arrest. Moreover, from the Raman spectra of DNA treated with different drugs, we find that the content of phosphate backbone and base pair groups in BBR-treated DNA are larger than those in JTZ or PMT. And this result reflects the strong capability of BBR breaking DNA backbone relative to JTZ or PMT, suggesting that the existence of methylene-dioxy on the 2, 3 units of A ring on the quinoline ring can greatly enhance the capability of BBR breaking DNA backbone, so the action effect of BBR-induced Jurkat cell apoptosis is better than those of PMT or JTZ. Further, by using Raman spectral imaging approach, we achieve the precise distribution of BBR in single cell, it is found that the receptor-mediated BBR targeting delivery based single-wall carbon nanotube and folic acid (SWNT/FA) reveals excellent performance in BBR targeting delivery relative to the conventional BBR diffusion approach. Importantly, these results demonstrate that Raman spectrum and spectral imaging should be a powerful tool to study the molecular mechanism of drug-induced cell apoptosis and evaluate the efficiency of drug delivery system.


Conflict of interest statement

The authors declare that there are no conflicts of interest related to this article.

Figures

Fig. 1
Fig. 1
The structural formula of Berberine, Jatrorrhizine, Palmatine, respectively.
Fig. 2
Fig. 2
Survival rate of Jurkat cells treated with BBR, JTZ or PMT, respectively.
Fig. 3
Fig. 3
Topographic images of Jurkat cells (a) without treatment; respectively treated with different drugs for 24h and 48h (b1) (b2) BBR; (c1)(c2) JTZ; (d1)(2) PMT, in which X, Y and Z represented the horizontal, vertical and height scanning ranges, respectively.
Fig. 4
Fig. 4
Bright field images and fluorescent images of Jurkat cells (a1)(a2) without treatment; treated with different drugs for 24h (b1)(b2) BBR; (c1)(c2)JTZ; (d1)(d2) PMT; treated with different drugs for 48h (e1)(e2) BBR; (f1)(f2) JTZ; (g1)(g2) PMT. Scale bar 10 um.
Fig. 5
Fig. 5
Average Raman spectra of Jurkat cells (a)without treatment; treated with different drugs for 24h (b)BBR; (c)JTZ; (d) PMT; (e)(f)(g) the spectral differences between (b) (c) (d) and (a), respectively.
Fig. 6
Fig. 6
Average Raman spectra of Jurkat cells (a)without treatment; treated with different drugs for 48h (b)BBR; (c)JTZ; (d)PMT; (e)(f)(g) the spectral differences between (b) (c) (d) and (a), respectively.
Fig. 7
Fig. 7
PCA scatter plots of PC1 and PC2 (or PC3) of Jurkat cells treated with different drugs and the corresponding loading curves during cell apoptosis (a)(b) in the early stage; (c)(d) in the late stage.
Fig. 8
Fig. 8
Intensity variations of selected Raman peaks in the drug-treated cells and the control group, in which the vertical axis was displayed as the intensity ratio of drug-treated cells to the control group.
Fig. 9
Fig. 9
Raman spectral imaging result of Jurkat cells treated with different drugs
Fig. 10
Fig. 10
Average Raman spectra of different drugs (a)BBR; (b)JTZ; (c)PMT; average Raman spectra of DNA (d)without treatment, treated with different drugs (e)BBR; (f)JTZ; (g)PMT, respectively.
Fig. 11
Fig. 11
The UV-vis absorption spectra of SWNT conjugated with different carriers (a)SWNT;(b) SWNT-PEG;(c) SWNT-PEG-FA;(d) SWNT -PEG-FA/BBR
Fig. 12
Fig. 12
Raman spectra of SWNT conjugated with different number carriers (a)SWNT;(b) SWNT-PEG;(c) SWNT-PEG-FA;(d) SWNT-PEG-FA/BBR
Fig. 13
Fig. 13
(a) UV-Vis absorption spectra variation of the prepared SWNT-PEG-FA/BBR with the BBR concentration; (b)the fitting curve of the absorbance with the BBR concentration. The dotted red line is 16 ug/mL.
Fig. 14
Fig. 14
Survival rate of Jurkat cells treated with different carriers (a) SWNT;(b)BBR;(c) SWNT-PEG-FA/BBR
Fig. 15
Fig. 15
Raman spectral imaging results during Jurkat cell uptake individual SWNT or synthesized SWNT-PEG-FA/BBR (a1)(a2)(a3)SWNT for 2h; (b1)(b2)(b3)SWNT for 6h; (c1)(c2)(c3)SWNT for 12h; (d1)(d2)(d3)SWNT-PEG-FA/BBR for 2h; (e1)(e2)(e3) SWNT-PEG-FA/BBR for 6h; (f1)(f2)(f3) SWNT-PEG-FA/BBR for 12h; in which the 1st, 2nd, 3rd rows respectively denoted the bright field image, magnified Raman image and Merge image (scale bar 2μm).
Fig. 16
Fig. 16
Bright field and fluorescence images of Jurkat cells treated with (a1)(a2), (b1)(b2) BBR; (c1)(c2), (d1)(d2) SWNT-PEG-FA/BBR (bar:10 um).

References

    1. Lu G. H., Wang L. M., Chen J. M., “Determination and utilization of berberine in plants of Berberis L,” J. Chin. Tradit. Herbal Drugs 30(6), 428–430 (1999).
    1. Xu S. H., He M. S., Liu X. P., “Berberine contents on B. triacanthophora,” J Chin Med Mater 26(3), 183–184 (2003).
    1. Wang Y., Kheir M. M., Chai Y., Hu J., Xing D., Lei F., Du L., “Comprehensive study in the inhibitory effect of berberine on gene transcription, including TATA box,” PLoS One 6(8), e23495 (2011). 10.1371/journal.pone.0023495 - DOI - PMC - PubMed
    1. Pazhang Y., Ahmadian S., Mahmoudian M., Shafiezadeh M., “Berberine-induced apoptosis via decreasing the survivin protein in K562 cell line,” Med. Oncol. 28(4), 1577–1583 (2011). 10.1007/s12032-010-9586-0 - DOI - PubMed
    1. Wu H. L., Hsu C. Y., Liu W. H., Yung B. Y., “Berberine-induced apoptosis of human leukemia HL-60 cells is associated with down-regulation of nucleophosmin/B23 and telomerase activity,” Int. J. Cancer 81(6), 923–929 (1999). 10.1002/(SICI)1097-0215(19990611)81:6<923::AID-IJC14>3.0.CO;2-D - DOI - PubMed

LinkOut - more resources