. 2019 Apr 29;4(2):204-221.
doi: 10.1016/j.jacbts.2018.12.001. eCollection 2019 Apr.

Characterization of a Unique Form of Arrhythmic Cardiomyopathy Caused by Recessive Mutation in LEMD2

Affiliations

Characterization of a Unique Form of Arrhythmic Cardiomyopathy Caused by Recessive Mutation in LEMD2

Nelly Abdelfatah et al. JACC Basic Transl Sci. .

Abstract

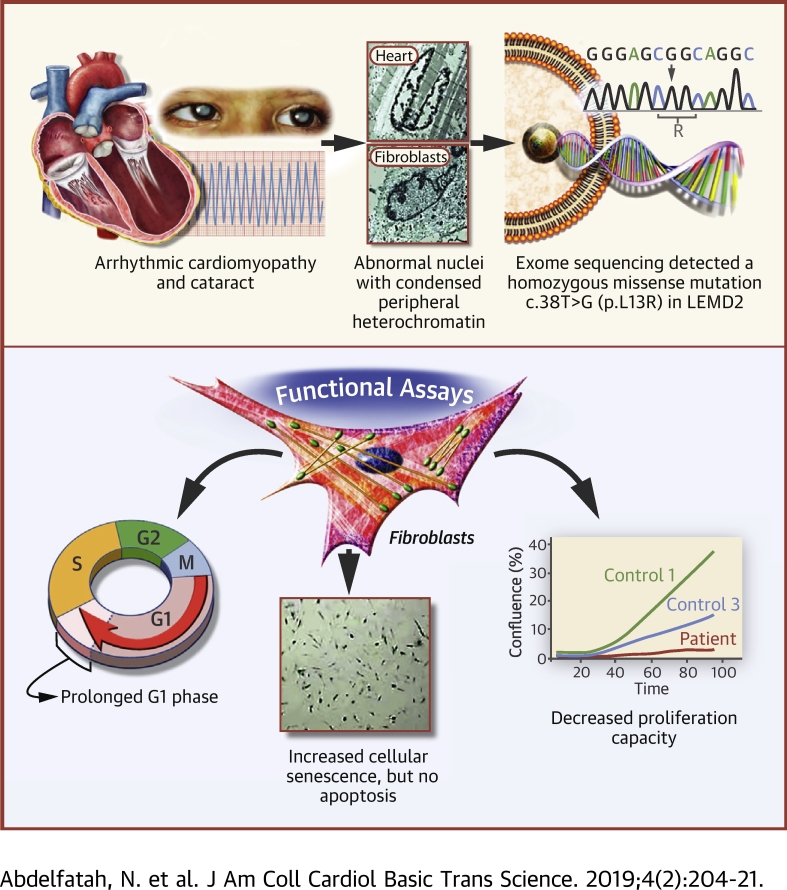
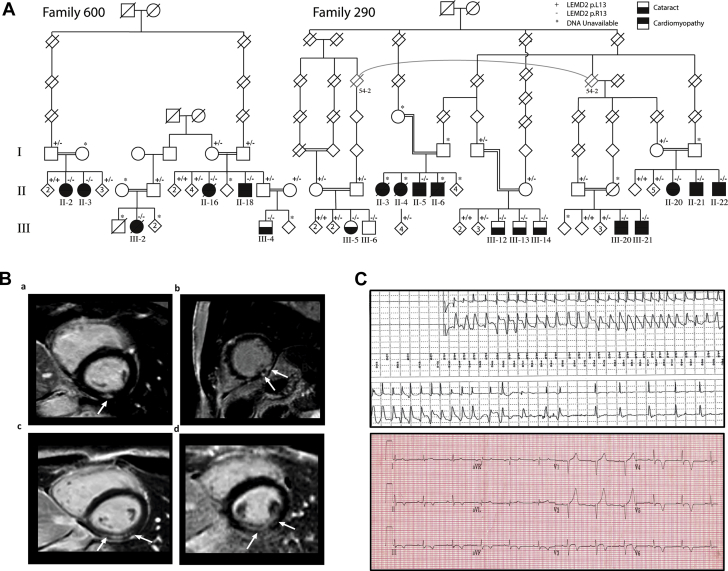
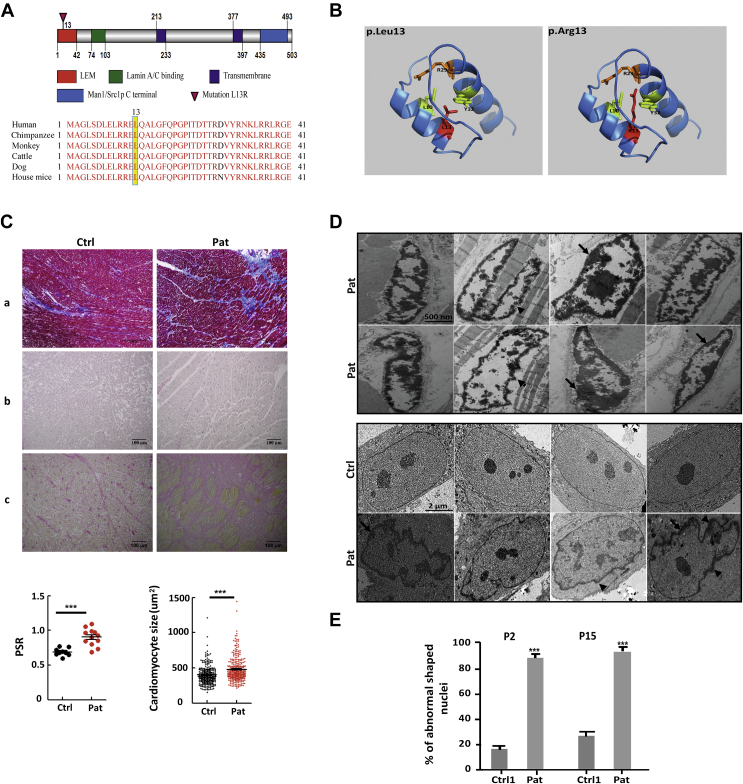
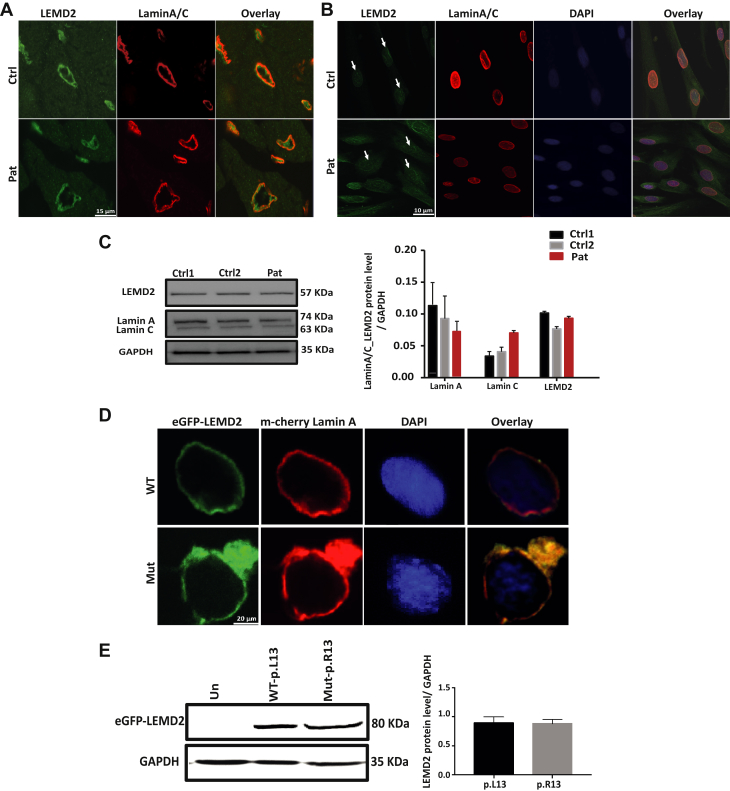
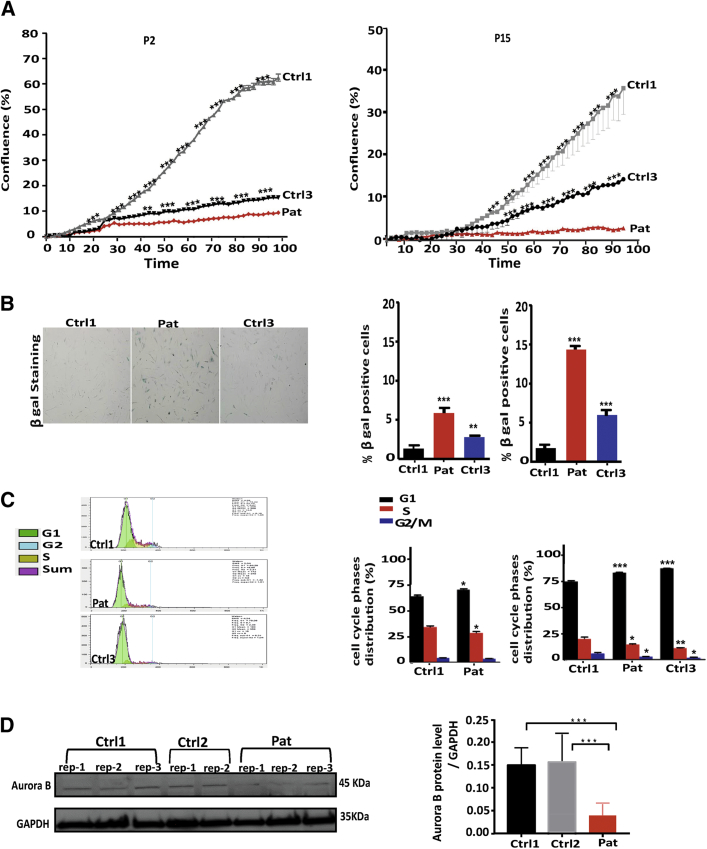
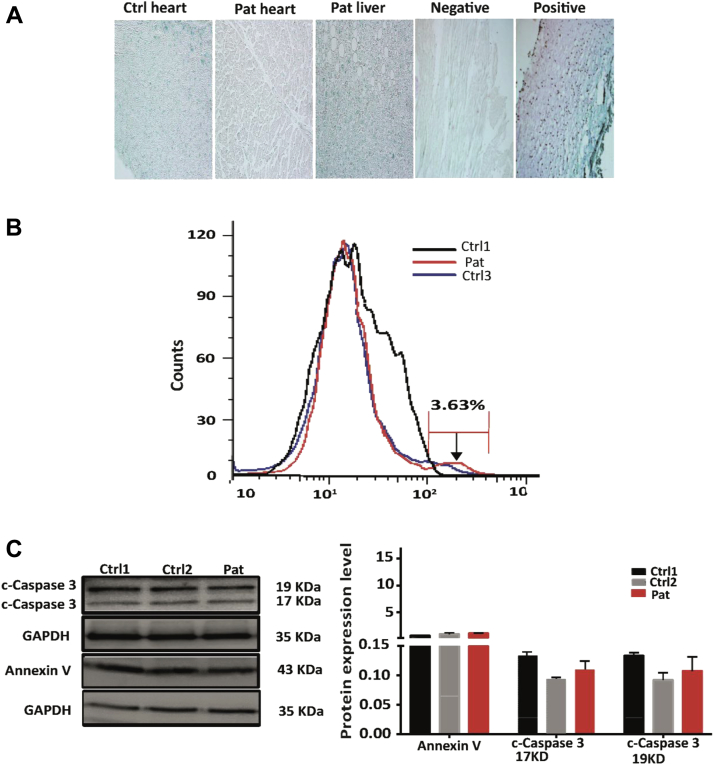
Nuclear envelope proteins have been shown to play an important role in the pathogenesis of inherited dilated cardiomyopathy. Here, we present a remarkable cardiac phenotype caused by a homozygous LEMD2 mutation in patients of the Hutterite population with juvenile cataract. Mutation carriers develop arrhythmic cardiomyopathy with mild impairment of left ventricular systolic function but severe ventricular arrhythmias leading to sudden cardiac death. Affected cardiac tissue from a deceased patient and fibroblasts exhibit elongated nuclei with abnormal condensed heterochromatin at the periphery. The patient fibroblasts demonstrate cellular senescence and reduced proliferation capacity, which may suggest an involvement of LEM domain containing protein 2 in chromatin remodeling processes and premature aging.

Keywords: ACM, arrhythmogenic cardiomyopathy; BANF, barrier to autointegration factor; CMR, cardiac magnetic resonance; DAPI, 4′,6′-diamidino-2-phenylindole; DCM, dilated cardiomyopathy; DNA, deoxyribonucleic acid; EMD, emerin; ICD, implantable cardioverter-defibrillator; LEMD2; LEMD2, LEM domain containing protein 2; LGE, late gadolinium enhancement; LMNA, lamin A/C; LV, left ventricular; NE, nuclear envelope; P, passage; PBS, phosphate-buffered saline; SAHF, senescence-associated heterochromatin foci; SNV, single nucleotide variant; chromatin remodeling; dilated cardiomyopathy; eGFP, enhanced green fluorescent protein; inner nuclear membrane; sudden death.


Figures

None
Graphical abstract
Figure 1
Figure 1
Clinical Features of 2 Extended Hutterite Families With Arrhythmic Cardiomyopathy and Juvenile Cataract (A) Pedigrees of 2 multigenerational Hutterite families of L-leut (family 600) and S-leut (family 290) descendants. Filled black squares (male subjects) and circles (female subjects) refer to affected individuals with cataract and arrhythmic cardiomyopathy. Filled upper half symbols indicate individuals diagnosed with arrhythmic cardiomyopathy. Filled lower half symbols refer to individuals with juvenile cataract. Diagonal lines indicate deceased individuals. Double lines refer to known consanguinity. The genotype indicated by a “+” is the p.L13 (wild-type) allele and that indicated by a “-” is the mutant p.R13 allele. (B) Short-axis views of late gadolinium enhancement cardiac magnetic resonance imaging of family 290, II-20 (a), II-22 (b), III-20 (c), and III-21 (d) confirming nearly transmural delayed enhancement of the inferior/inferolateral walls as indicated by the arrows. (C) Rhythm strip of individual 600, II-18 recorded by the implantable cardioverter-defibrillator before delivering an appropriate shock (upper panel). Representative 12-lead electrocardiogram of the same individual showing deep T-wave inversions inferior and lateral corresponding to areas of fibrosis in the cardiac magnetic resonance image (lower panel). DNA = deoxyribonucleic acid; LEMD2 = LEM domain containing protein 2.
Figure 2
Figure 2
The Mutation p.L13R in LEMD2 Causes Interstitial Fibrosis and Abnormal Nuclei in Affected Myocardial Tissue and Fibroblasts (A) Protein domain structure of human LEM domain containing protein 2 (LEMD2) and conserved motifs. (Top) the LEMD2 protein consists of an LEM domain, lamin A/C–binding domain, 2 transmembrane domains, and a Man1/Src1p C-terminal domain. Domain information was obtained from UniProt and Brachner et al. . The red arrow indicates the location of the human mutation. (Bottom) The leucine residue at position 13 (yellow shadow) of LEMD2 is conserved across species. (B) Predicted 3-dimensional structure of the N-terminal domain of LEMD2 with wild-type leucine (Leu) in the left panel and the replaced arginine (Arg) at position 13 in the right. (C) Histology of cardiac tissue from patient 600, II-16 (Pat) showing extensive interstitial fibrosis and myocyte hypertrophy compared with the control (Ctrl). a, Masson’s trichrome (scale bar: 500 μm) staining shows fibrotic tissue in blue; b, hematoxylin and eosin staining (scale bar: 100 μm) and (c) picro sirius red (PSR) demonstrate collagen deposits (scale bar: 100 μm). Myocyte size in hematoxylin and eosin and collagen deposits in PSR were significantly increased in Pat vs. Ctrl; ***p < 0.001. (D) Representative images of affected myocardial tissue (upper panel) recorded by transmission electron microscopy revealed elongation and bizarre shapes/invagination of the membrane (arrowheads) of nuclei with clumping of peripheral heterochromatin (arrows). Transmission electron microscope images of fibroblasts (lower panel) from patient 600, II-18 (Pat) and age-matched control (Ctrl1). Note the abnormal morphology (arrowhead) of the nuclei and the condensed heterochromatin (arrows). (E) Quantification of abnormal nuclei in patient and age-matched control fibroblasts at passage 2 (P2) and passage 15 (P15); n = 300 nuclei, respectively. There is a significant increase of abnormal nuclei in the patient cells (Pat) compared with the control (Ctrl1); n = 300 nuclei; ***p < 0.001.
Figure 3
Figure 3
Unchanged LEMD2 Localization and Expression in Patient Cells, Cardiac Tissue, and Transfected C2C12 Cells (A and B) Representative confocal images of patient and control myocardial tissue as well as fibroblasts showing normal localization of LEMD2 (green, arrow) co-localizing with lamin A/C (red) at the nuclear membrane; 4′,6′-diamidino-2-phenylindole (DAPI) (blue) indicates nuclei. Scale bars represent 20 μm. (C) Western blot showing LEMD2 and lamin A/C protein expression in fibroblasts in the left panel. Glyceraldehyde-3-phosphate dehydrogenase (GAPDH) was used as loading control. Quantification by densitometry (n = 3 experiments with 2 to 3 replicates) of LEMD2; quantification of lamin A and C and LEMD2 protein expression in the right panel shows no difference. (D) Representative confocal images of transfected C2C12 cells with recombinant enhanced green fluorescent protein (eGFP)-tagged wild-type (WT) (p.L13) or mutant (p.R13) LEMD2 (green) co-transfected with mCherry–lamin A/C (LMNA) (red) demonstrated co-localization. Scale bar represents 20 μm. (E) Western blot analysis of eGFP-LEMD2 proteins after transfection into HEK293 cells. GAPDH was used for loading control. Quantification by densitometry (n = 3) reveals no difference in the protein level between mutant (p.R13) and WT (p.L13) LEMD2. Un = un-transfected; other abbreviations as in Figure 2.
Figure 4
Figure 4
The LEMD2 p.L13R Mutation Inhibits Proliferation, Induces Cell Senescence, and Cell Cycle Arrest in Fibroblasts (A) Cell proliferation assay based on confluence from passage 2 (P2) in the left panel and P15 in the right panel in patient (Pat) fibroblasts, Ctrl1, and an older age (“high-senescence”) control (Ctrl3). There was a significant difference in the rate of proliferation detected between both control subjects and patient at P2 and P15. The cells were imaged every 2 h for 90 h. n = 8 wells, mean ± SD, ***p < 0.001. (B) Images of β-galactosidase (β gal)-stained fibroblasts from patient and Ctrl1 as well as Ctrl3 at passage 6 (P6) and P15 in the left panel. Note that the amount of blue-stained cells is visibly higher in patient cells. (Right) Quantification of β gal–stained cells revealed increased cell senescence in patient cells compared with both control subjects at passages as indicated (n = 3; **p < 0.01; ***p < 0.001). (C) Fibroblasts stained with propidium iodide and measurements of the deoxyribonucleic acid content for each phase of the cell cycle by flow cytometry. Cells were taken from Ctrl1 at P6 and 9, from the patient (Pat) at passage 8 and passage 11, and from Ctrl3 at passage 12. Representative diagrams of each phase of the cell cycle are shown in the left panel. (Right) Quantification of the deoxyribonucleic acid content showed a potential arrest in the G1 phase in patient fibroblasts compared with Ctrl1 and similar to Ctrl3 at later passage. n = 3; ∗∗p < 0.01; ∗p < 0.05; ***p < 0.001. (D) Western blot of Aurora B protein expression in patient and control cells on the left panel. GAPDH was used as loading control. (Right) Quantification by densitometry of Aurora B protein expression revealed a significant difference between both control subjects and patient fibroblasts. n = 3 experiments with each 2 to 3 replicates; ***p < 0.001. Abbreviations as in Figures 2 and 3.
Figure 5
Figure 5
The Mutation in LEMD2 Does Not Induce Significant Apoptosis (A) Apoptosis assays were conducted by labeling the deoxyribonucleic acid with 5-bromo-2′-deoxyuridine 5′-triphosphate) in heart and liver tissue from the affected patient (family 600, II-16) and control heart samples. A positive control was created by adding 1 μg/μl deoxyribonucleic acids. Apoptotic cells were detected as brown dots. No signs of apoptosis were detected in all tested tissue. (B) Terminal deoxynucleotidyltransferase-mediated dUTP nick end labeling staining of fibroblasts and flow cytometry from patient and Ctrl1 and Ctrl3. The histograms of the fluorescein signal collected by using the terminal deoxynucleotidyltransferase-mediated dUTP nick end labeling method are shown. There is no difference in the apoptotic signals between the 2 control subjects and patient cells. (C) Western blot analysis of apoptotic markers (annexin V, caspase 3 [2 subunits: 17 and 19 KD]) in patient and control fibroblasts on the left panel. GAPDH was used as loading control. Quantification of apoptotic markers by densitometry does not show a significant difference in expression levels (n = 3 experiments with each 2 to 3 replicates). Abbreviations as in Figures 2, 3, and 4.

References

    1. Dellefave L., McNally E.M. The genetics of dilated cardiomyopathy. Curr Opin Cardiol. 2010;25:198–204. - PMC - PubMed
    1. Haas J., Frese K.S., Peil B. Atlas of the clinical genetics of human dilated cardiomyopathy. Eur Heart J. 2015;36:1123–1135. - PubMed
    1. Schreiber K.H., Kennedy B.K. When lamins go bad: nuclear structure and disease. Cell. 2013;152:1365–1375. - PMC - PubMed
    1. Fatkin D., MacRae C., Sasaki T. Missense mutations in the rod domain of the lamin A/C gene as causes of dilated cardiomyopathy and conduction-system disease. N Engl J Med. 1999;341:1715–1724. - PubMed
    1. Bione S., Maestrini E., Rivella S. Identification of a novel X-linked gene responsible for Emery-Dreifuss muscular dystrophy. Nat Genet. 1994;8:323–327. - PubMed

LinkOut - more resources