. 2019 Jun 20;47(11):5963-5972.
doi: 10.1093/nar/gkz336.

Structure-guided post-SELEX optimization of an ochratoxin A aptamer

Affiliations

Structure-guided post-SELEX optimization of an ochratoxin A aptamer

Guohua Xu et al. Nucleic Acids Res. .

Abstract

SELEX is the cornerstone for aptamer research with broad applications in biosensors and medicine. To improve the affinity of selected aptamers, we propose a structure-guided post-SELEX approach, an optimization method based on the precise secondary structure of the aptamer-ligand complex. We demonstrate this approach using the Ochratoxin A (OTA) aptamer. Guided by the structure, we designed a new aptamer whose affinity is improved by more than 50-fold. We also determined the high-resolution NMR structure of the new aptamer-OTA complex and elucidated the discriminatory recognition mechanism of one atomic difference between two analogs, OTA and OTB. The aptamer forms an unusual hairpin structure containing an intramolecular triple helix, which is not seen in the previously determined aptamer complex. The π-π stacking, the hydrophobic interaction, hydrogen bonds and halogen bonds between OTA and the aptamer contribute to the recognition of OTA, and the halogen bonds play an important role in discriminating between OTA and OTB. Our results demonstrate that the structure-guided post-SELEX approach improves aptamers affinity. An improved OTA biosensor system might be developed using this new strategy.


Figures

Figure 1.
Figure 1.
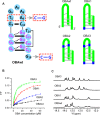
1H NMR spectra of the OBA aptamer titrated with OTA and OTB. (A) Sequence of aptamer OBAwt and chemical structures of OTA and OTB. (B) Imino regions of 1H NMR spectra of OBAwt (0.1 mM) titrated with OTA (left) and OTB (right) in the presence of 10 mM Mg2+ at 288 K.
Figure 2.
Figure 2.
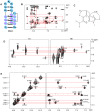
Spectra of the OBAwt OTA complex in phosphate buffer containing Mg2+. (A) NOESY spectra showing H8/H6-H1′ connectivity in D2O at 288 K (mixing time, 300 ms). Intraresidue H6/H8-H1′ NOE cross-peaks are labeled. Locations mark with an asterisk (*) represent unobserved cross peaks. (B) Schematic representation of G–G–C triple. (C) NOESY spectra showing H1 protons assignments H2O solvent at 288 K (mixing time, 100 ms).
Figure 3.
Figure 3.
Secondary structures and function of the original OBA aptamer (OBAwt) and its variants (OBA1─3). (A) The sequence of OBAwt is shown on the left. The Watson-Crick and Hoogsteen hydrogen bonds are represented by solid- and dashed- bars, respectively. OBAwt and each variant are represented on the right. (B) Fluorescence polarization titration of OTA with OBA to test the effect of mutation on affinity (OBAwt, black; OBA1, red; OBA2, blue; OBA3, green). (C) Imino regions of 1H spectra of OBA with 2 equivalents of OTA in 10 mM Mg2+ at 288 K.
Figure 4.
Figure 4.
NMR spectra of the OBA3─OTA complex in phosphate buffer containing Mg2+. (A) The sequence of OBA3. The Watson-Crick and Hoogsteen hydrogen bonds are represented by solid- and dashed- bars, respectively. (B) NOESY spectra showing H8/H6-H1′ connectivity of OBA3 in D2O at 288K (mixing time, 300 ms). Intraresidue H6/H8-H1′ NOE cross-peaks are labeled with residue numbers. Peaks labeled (*) are not observed. (C) A schematic indicating long-range J-couplings between imino and H8 protons via 13C5 within the guanosine base. (D) H1 and H8 proton assignments by through-bond correlations between imino and H8 protons via 13C5 shown in (C) at natural abundance at 298 K. (E) NOESY spectra showing H1 protons assignments of OBA3 in H2O at 288 K (mixing time, 300 ms).
Figure 5.
Figure 5.
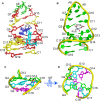
Structure of the OBA3─OTA complex. (A) Ten superimposed refined structures. (B) Cartoon representation of the lowest energy structure. (C, D) Triplex structure formed within OBA3─OTA complex. The G12:G4:C16 plane, the G13:G3:C17 plane and the G14:G2:C118 plane are colored green, cyan and magenta, respectively. Prepared using PyMOL (Version 0.99rc6, Schrodinger, LLC).
Figure 6.
Figure 6.
Expanded view of the OTA-binding site in the OBA3-OTA structure. (A) A stick view of the binding pocket. (B) Stacking of the isocoumarin ring of OTA between G5–C11 and G4–G12. (C) Stacking of the benzene ring of OTA on G4–C16. (DE) Two models of intermolecular hydrogen-bonding between OTA and OBA3. (F) The potential hydrogen- and halogen-bonds are shown as dashes. Interaction lengths and angles are provided.

Similar articles

Cited by

References

    1. Tuerk C., Gold L.. Systematic evolution of ligands by exponential enrichment: RNA ligands to bacteriophage T4 DNA polymerase. Science. 1990; 249:505–510. - PubMed
    1. Ellington A.D., Szostak J.W.. In vitro selection of RNA molecules that bind specific ligands. Nature. 1990; 346:818–822. - PubMed
    1. Verdian A. Apta-nanosensors for detection and quantitative determination of acetamiprid - a pesticide residue in food and environment. Talanta. 2018; 176:456–464. - PubMed
    1. Teng I.T., Li X.W., Yadikar H.A., Yang Z.H., Li L., Lyu Y.F., Pan X.S., Wang K.K., Tan W.H.. Identification and characterization of DNA aptamers specific for phosphorylation epitopes of tau protein. J. Am. Chem. Soc. 2018; 140:14314–14323. - PMC - PubMed
    1. Syed M.A., Jamil B.. Aptamers and aptasensors as novel approach for microbial detection and identification: an appraisal. Curr. Drug Targets. 2018; 19:1560–1572. - PubMed

Publication types