

Absolute quantification of donor-derived cell-free DNA as a marker of rejection and graft injury in kidney transplantation: Results from a prospective observational study
- PMID: 31062511
- PMCID: PMC6899936
- DOI: 10.1111/ajt.15416
Absolute quantification of donor-derived cell-free DNA as a marker of rejection and graft injury in kidney transplantation: Results from a prospective observational study
Abstract
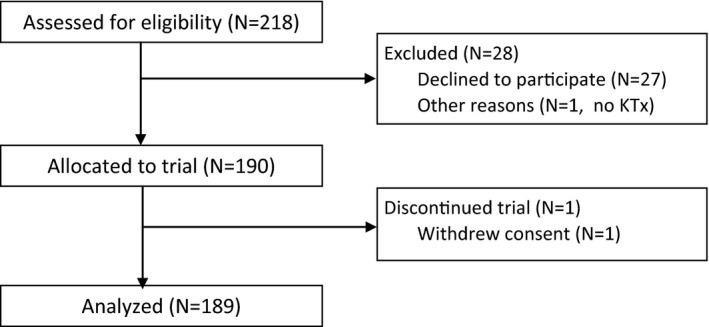
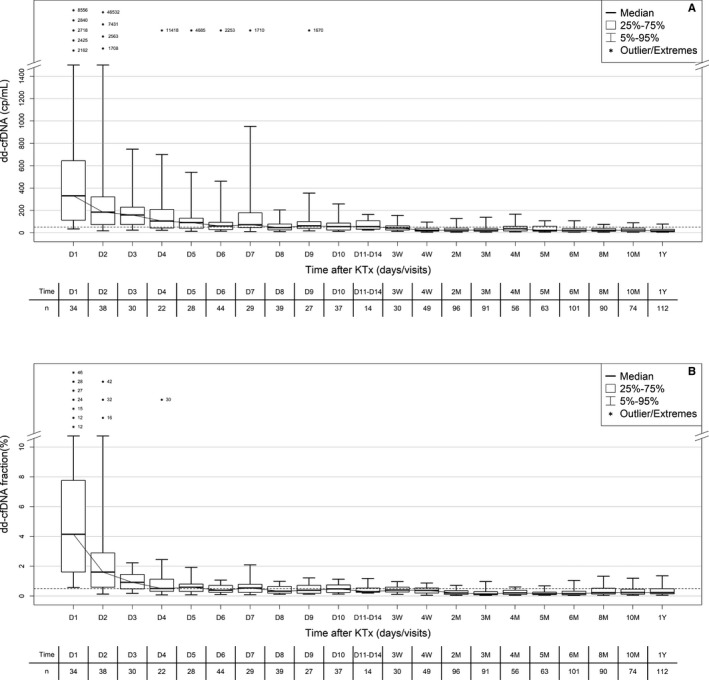
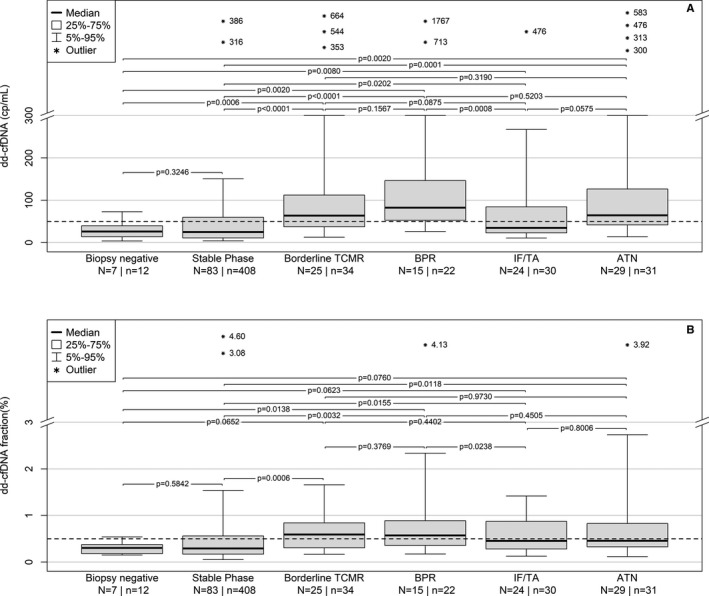
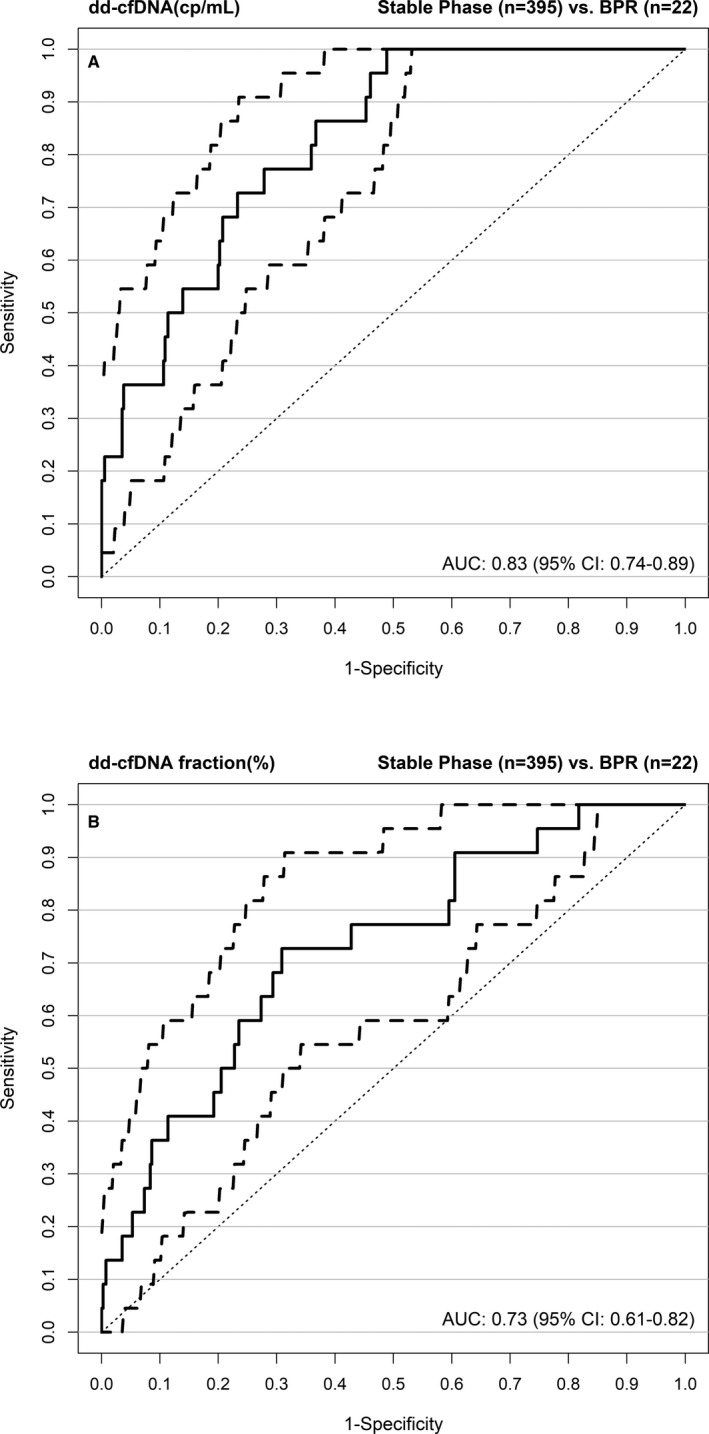
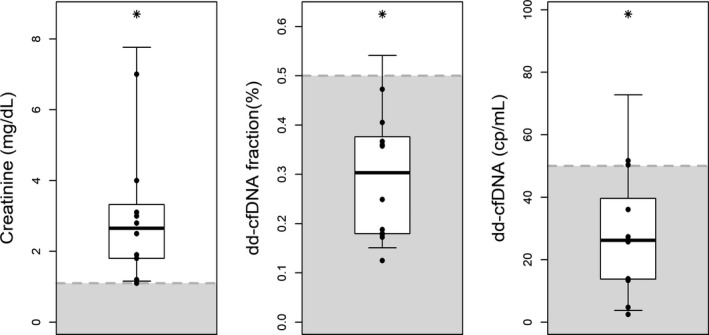
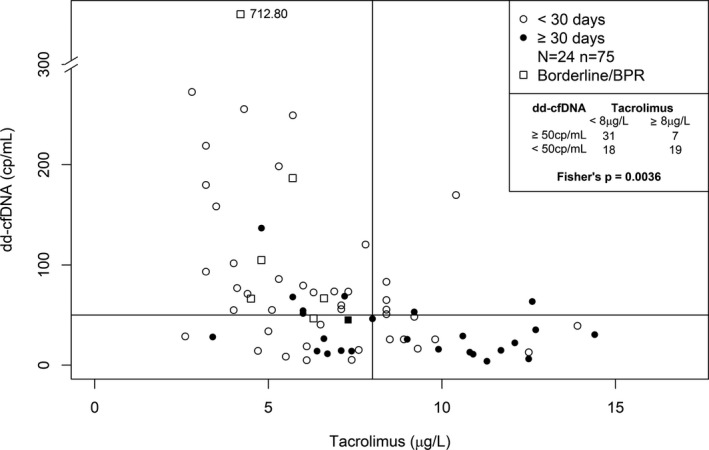
Donor-derived cell-free DNA (dd-cfDNA) is a noninvasive biomarker for comprehensive monitoring of allograft injury and rejection in kidney transplantation (KTx). dd-cfDNA quantification of copies/mL plasma (dd-cfDNA[cp/mL]) was compared to dd-cfDNA fraction (dd-cfDNA[%]) at prespecified visits in 189 patients over 1 year post KTx. In patients (N = 15, n = 22 samples) with biopsy-proven rejection (BPR), median dd-cfDNA(cp/mL) was 3.3-fold and median dd-cfDNA(%) 2.0-fold higher (82 cp/mL; 0.57%, respectively) than medians in Stable Phase patients (N = 83, n = 408) without rejection (25 cp/mL; 0.29%). Results for acute tubular necrosis (ATN) were not significantly different from those with biopsy-proven rejection (BPR). dd-cfDNA identified unnecessary biopsies triggered by a rise in plasma creatinine. Receiver operating characteristic (ROC) analysis showed superior performance (P = .02) of measuring dd-cfDNA(cp/mL) (AUC = 0.83) compared to dd-cfDNA(%) (area under the curve [AUC] = 0.73). Diagnostic odds ratios were 7.31 for dd-cfDNA(cp/mL), and 6.02 for dd-cfDNA(%) at thresholds of 52 cp/mL and 0.43%, respectively. Plasma creatinine showed a low correlation (r = 0.37) with dd-cfDNA(cp/mL). In a patient subset (N = 24) there was a significantly higher rate of patients with elevated dd-cfDNA(cp/mL) with lower tacrolimus levels (<8 μg/L) compared to the group with higher tacrolimus concentrations (P = .0036) suggesting that dd-cfDNA may detect inadequate immunosuppression resulting in subclinical graft damage. Absolute dd-cfDNA(cp/mL) allowed for better discrimination than dd-cfDNA(%) of KTx patients with BPR and is useful to avoid unnecessary biopsies.
Keywords: biomarker; clinical decision-making; clinical research/practice; immunosuppressant; immunosuppression/immune modulation; kidney failure/injury; kidney transplantation/nephrology; rejection.
© 2019 The Authors. American Journal of Transplantation published by Wiley Periodicals, Inc. on behalf of The American Society of Transplantation and the American Society of Transplant Surgeons.
Figures
References
-
- Knight SR, Thorne A, Faro MLL. Donor‐specific cell‐free DNA as a biomarker in solid organ transplantation. A systematic review. Transplantation. 2018;103:273‐283. - PubMed
Publication types
MeSH terms
Substances
LinkOut - more resources
Full Text Sources
Other Literature Sources
Medical
Miscellaneous
