. 2020 Jun;21(5):339-356.
doi: 10.1080/15622975.2019.1615638. Epub 2019 Jun 4.

Evidence for altered excitatory and inhibitory tone in the post-mortem substantia nigra in schizophrenia

Affiliations

Evidence for altered excitatory and inhibitory tone in the post-mortem substantia nigra in schizophrenia

Samuel J Mabry et al. World J Biol Psychiatry. 2020 Jun.

Abstract

Objectives: The substantia nigra (SN) receives glutamatergic and GABAergic inputs that regulate dopaminergic neuronal activity. Imaging studies have shown hyperactivity of the SN in schizophrenia (SZ) patients. We examined neurochemically defined inputs to the SN, synaptic density, and neuromelanin content that might contribute to or reflect this hyperexcitability.Methods: Glutamatergic axon terminals were identified by the immunohistochemical localisation of vGLUT1 and vGLUT2; GABA inputs were identified by the immunohistochemical localisation of GAD67. Neuromelanin granules are visible in unstained sections and thus were assessed in unstained sections. Optical densitometry was measured to assess the density of vGLUT1, vGLUT2 or GAD67 immunolabelled axon terminals and neuromelanin granules. Electron microscopy was used to quantify synaptic and mitochondrial density.Results: Compared to controls, SZ subjects had nonsignificant trends toward a decrease in vGLUT1, and an increase in both vGLUT2 and GAD67. vGLUT1 was negatively correlated with GAD67 in normal controls (NCs) and positively correlated in SZ subjects. A correlation of coefficient analysis showed a significant difference between the negative correlation in NCs and the positive correlation in SZ subjects. Frequency histograms showed the distribution of neuromelanin density was different in SZ subjects compared to NCs. Synaptic density data showed a decrease in inhibitory synapses in SZ subjects. Mitochondrial density was normal in SZ subjects.Conclusions: Synaptic density alterations and the lack of a positive correlation between GAD67 and vGLUT1 could contribute to hyperactivity in the SN.

Keywords: Ultrastructure; dopamine; mitochondria; neuromelanin; synapses.


Figures
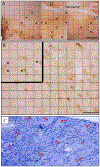
Figure 1:
Figure 1:
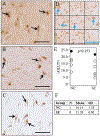
A. A montage illustrating the full extent of the SN in this section: it is immunostained for vGLUT1. The blue box indicates the central region in which the electron microscopic analysis was performed. To the left of the box is the lateral region and to the right of the box is the medial region. For light microscopy, using a random number generator, 20 boxes (*) within the SN in each section were identified and selected for further analysis. Each box in this image is approximately equal to the area of one photomicrograph taken at 20× magnification. L, lateral. D, dorsal. V, ventral. M, medial. CP= cerebral peduncle. B. A photomicrograph taken at 20× magnification where the top right 5×5 boxes (outlined) were used for densitometry analysis. C. A semi-thin section stained with thionin taken from the block face prior to thin sectioning. Large neurons (red arrows) are scattered throughout verifying the location to be in the SN. Scale bars: A=1 mm, B=100 μm, C=XX.
Figure 2:
Figure 2:
Comparison of normal controls (NCs) and patients with schizophrenia (SZ) for vGLUT1. A–B. Examples of photomicrographs taken for analysis from a NC (A) and a patient with SZ (B). Arrows point to examples of dopaminergic cell bodies. C. Example of control processed without the primary antibody. Arrows point to examples of dopaminergic cell bodies. Note the absence of specific immunolabelling in the neuropil. D. Higher power view of labeled puncta (arrows) showing nine of the 25 grids per 20× box. E. Graph shows average optical densities in relative units. The filled in circles represent the cases illustrated in panels A and B. F. Table with means and standard deviations for vGLUT1. Scale bars: A=100 μm, B=50 μm.
Figure 3:
Figure 3:
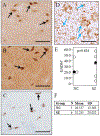
Comparison of normal controls (NCs) and patients with schizophrenia (SZ) for vGLUT2. A–B. Examples of photomicrographs taken for analysis from a NC (A) and a patient with SZ (B). Arrows point to dopaminergic cell bodies. C. Example of control processed without the primary antibody. Arrows point to examples of dopaminergic cell bodies. Note the absence of specific immunolabelling in the neuropil. D. Higher power view of labeled puncta (arrows). E. Graph shows average optical densities in relative units. The filled in circles represent the cases illustrated in panels A and B. F. Table with means and standard deviations for vGLUT2. Scale bars: A=100 μm, B=50 μm.
Figure 4:
Figure 4:
Comparison of normal controls (NCs) and patients with schizophrenia (SZ) for GAD67. A. Examples of photomicrographs taken for analysis from a NC (A) and a patient with SZ (B). Arrows point to dopaminergic cell bodies. C. Example of control processed without the primary antibody. Arrows point to examples of dopaminergic cell bodies. Note the absence of specific immunolabelling in the neuropil. D. Higher power view of labeled puncta (arrows). E. Graph shows average optical densities in relative units. The filled in circles represent the cases illustrated in panels A and B. There are only four NCs for this analysis as one of the NCs failed to stain for GAD67. F. Table with means and standard deviations for GAD67. Scale bars: A=100 μm, B=50 μm.
Figure 5:
Figure 5:
Regional analysis of correlations between vGLUT1 and GAD67 for NCs (A-C) and SZ patients (A’-C’). P values and R2 values are shown for each comparison. A, A’. Data analysed in the lateral portion of the SN. A two correlation coefficient test showed no significant difference between groups (two-tailed, p<0.095). B,B’. Data analysed in the central portion of the SN. A two correlation coefficient test showed a significant difference between groups (two-tailed, p<0.023). C,C’. Data analysed in the medial portion of the SN. A two correlation coefficient test showed no significant difference between groups (two tailed, p<0.267).
Figure 6:
Figure 6:
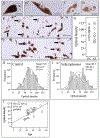
Comparison of normal control (NC) and patients with schizophrenia (SZ) for density of neuromelanin granules. A–D. Examples of neurons with varying densities of neuromelanin granules. Dotted line in (A) outlines the borders of the cell where neuromelanin pigment is scarce or absent. n, nucleus. E–F. Photomicrographs of unstained tissue from a NC (E) and patient with SZ (F). Arrows indicate examples of (but not all) dopaminergic neurons filled with neuromelanin pigment. G. Comparison of the optical density of neuromelanin pigment between groups (n=12 cases in each group); overlapping values obscure some of the circles. H–I. A frequency histogram for NC (H) and patients with SZ (I) of the distribution of optical density values per photograph. N equals the number of photomicrographs (each containing an average of 29 neurons). Kolmogorov–Smirnov analysis indicated that the distribution of curves was significantly different between NCs and SZs (p<0.0001). J. A graph showing the correlation of optical density values with age. Scale bars: A–D=25 μm, E–F=50 μm.
Figure 7:
Figure 7:
Electron micrographs of synapses in subjects with SZ (A,B) and in NCs (C-E). A. Synapses are denoted with arrows; thin red arrows show inhibitory synapses, green arrow shows an excitatory synapse and blue arrows show synapses with postsynaptic densities of intermediate thickness. Axon terminals are outlined in black. B. A perforated synapse showing a pronounced presynaptic density (notched tail blue arrows), and a postsynaptic density (blue arrows in dendrite). C. An axon terminal forming a synapse with a prominent presynaptic density (purple arrows). D. An axon terminal forming an excitatory synapse (green arrow); there is no presynaptic density in the terminal. E. Two axon terminals forming inhibitory synapses (red arrows) with a dendrite; neither of these terminals contain a presynaptic density. Axon terminals, AT. Mitochondria, M. Scale bars: A–E=500 nm.
Figure 8:
Figure 8:
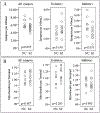
A. Graphs comparing the synaptic density per 100μm2 of all synapses, asymmetric synapses and symmetric synapses. Patients with SZ had a trend toward fewer total synapses and had significantly fewer inhibitory synapses than controls. B. Graphs comparing the number of mitochondria per all axon terminals, terminals forming excitatory synapses, and terminals forming inhibitory synapses between groups. There were no significant differences between groups for any of these measures.

References

    1. Akil M, Pierri JN, Whitehead RE, Edgar CL, Mohila C, Sampson AR, Lewis DA. 1999. Lamina-specific alterations in the dopamine innervation of the prefrontal cortex in schizophrenic subjects. Am J Psychiatry 156(10):1580–1589. - PubMed
    1. Akil M, Edgar CL, Pierri JN, Casali S, Lewis DA. 2000. Decreased density of tyrosine hydroxylase immunoreactive axons in the entorhinal cortex of schizophrenic subjects. Biol Psychiatry 47:361–370. - PubMed
    1. American Psychiatric Association. 2013. Diagnostic and statistical manual of mental disorders (5th ed). Arlington, VA: American Psychiatric Publishing.
    1. Babcock DF, Hille B. 1998. Mitochondrial oversight of cellular Ca2+ signaling. Curr Opin Neurobiol 8:398–404. - PubMed
    1. Barker DJ, Root DH, Zhang S, Morales M. 2016. Multiplexed neurochemical signaling by neurons of the ventral tegmental area. J Chem Neuroanat 73:33–42 - PMC - PubMed

Publication types