. 2019 Aug 1;188(8):1529-1538.
doi: 10.1093/aje/kwz110.

Force of Infection and True Infection Rate of Dengue in Singapore: Implications for Dengue Control and Management

Affiliations

Force of Infection and True Infection Rate of Dengue in Singapore: Implications for Dengue Control and Management

Li Kiang Tan et al. Am J Epidemiol. .

Abstract

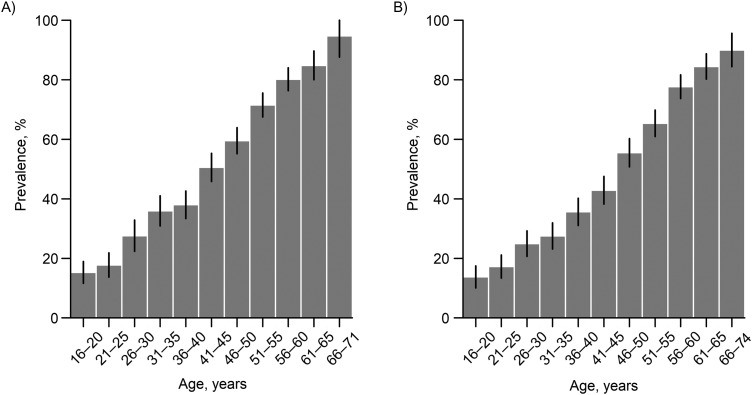
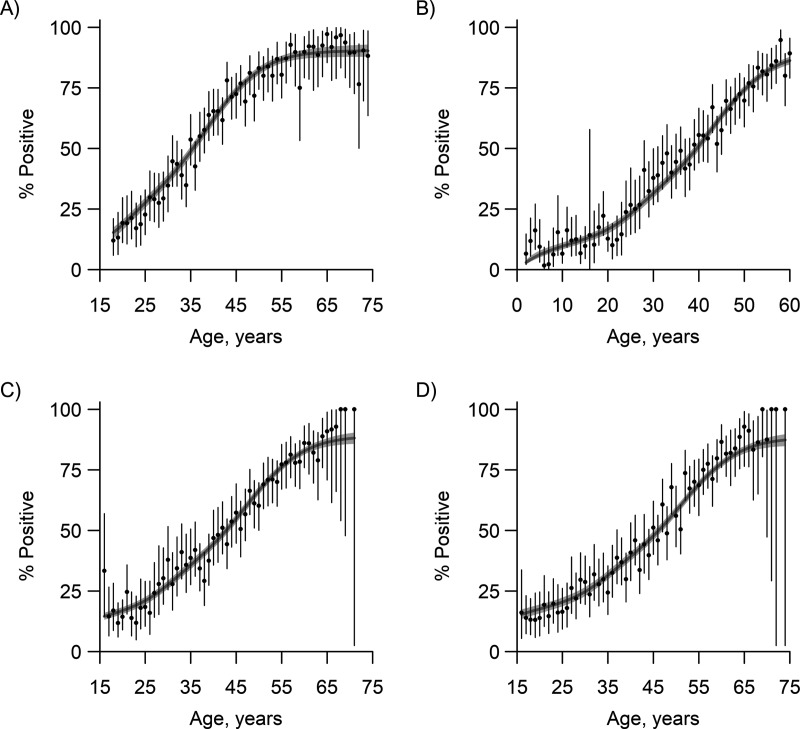
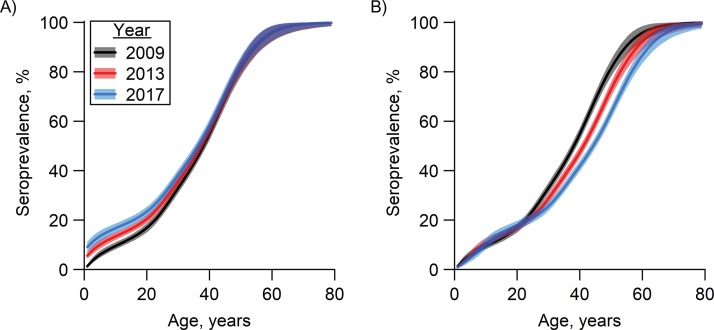
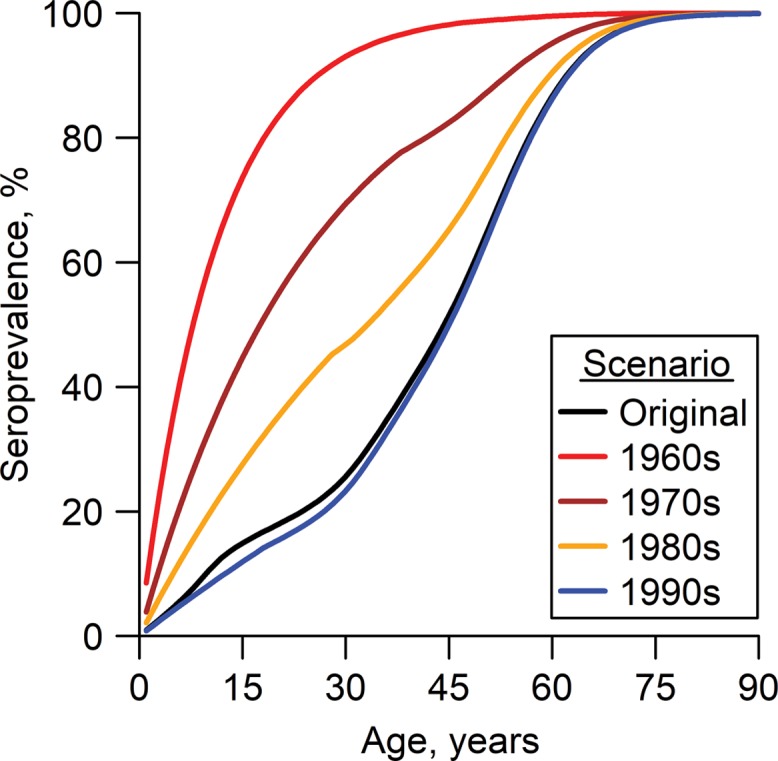
National data on dengue notifications do not capture all dengue infections and do not reflect the true intensity of disease transmission. To assess the true dengue infection rate and disease control efforts in Singapore, we conducted age-stratified serosurveys among residents after a 2013 outbreak that was the largest dengue outbreak on record. The age-weighted prevalence of dengue immunoglobulin G among residents was 49.8% (95% confidence interval: 48.4, 51.1) in 2013 and 48.6% (95% confidence interval: 47.0, 50.0) in 2017; prevalence increased with age. Combining these data with those from previous serosurveys, the year-on-year estimates of the dengue force of infection from 1930 to 2017 revealed a significant decrease from the late 1960s to the mid-1990s, after which the force of infection remained stable at approximately 10 per 1,000 persons per year. The reproduction number (R0) had also declined since the 1960s. The reduction in dengue transmission may be attributed to the sustained national vector program and partly to a change in the age structure of the population. The improved estimated ratio of notified cases to true infections, from 1:14 in 2005-2009 to 1:6 in 2014-2017, signifies that the national notification system, which relies on diagnosed cases, has improved over time. The data also suggest that the magnitudes of dengue epidemics cannot be fairly compared across calendar years and that the current disease control program remains applicable.

Keywords: Bayesian model; basic reproduction number; dengue; force of infection; infectious disease; seroprevalence; vector control.


Figures

Figure 1.
Figure 1.
Age-specific prevalence of dengue immunoglobulin G (IgG) in serological samples collected in Singapore in 2013 (A) and 2017 (B). The presence of dengue IgG in the serum samples was determined using the Panbio Dengue IgG Indirect ELISA (Alere Inc., Waltham, Massachusetts). Confidence intervals (black bars) were constructed using Wald's method. Participants aged 66 years or more were combined into one group because of the small sample size. ELISA, enzyme-linked immunosorbent assay.
Figure 2.
Figure 2.
Estimated annual dengue force of infection (FOI) in Singapore during the periods 1931–2017 (A) and 1990–2015 (B). An overall declining trend in FOI estimates was observed from 1931 to 2017 (A); however, the FOI estimates increased slightly from 1999 to 2008 and then decreased (B). Solid lines represent the point estimates, and shaded regions represent the 95% Bayesian credible intervals. The model was developed using 2004, 2009, 2013, and 2017 serosurvey data.
Figure 3.
Figure 3.
Comparison of empirical and reconstructed prevalences of dengue immunoglobulin G from independent serosurveys carried out in Singapore in 2004, 2009, 2013, and 2017. Empirical estimates are shown as black dots and 95% Clopper-Pearson confidence intervals by black bars. Solid gray lines represent the model estimates for 2004 (A), 2009 (B), 2013 (C), and 2017 (D), with the gray shaded regions representing 95% Bayesian credible intervals. Degradation of the sensitivity of the enzyme-linked immunosorbent assay over time was taken into account in the reconstructed estimates.
Figure 4.
Figure 4.
Dengue seroprevalence by age and year among residents of Singapore, generated with Bayesian modeling, 2009, 2013, and 2017. Lines represent posterior median values for seroprevalence, and shaded areas represent 95% Bayesian credible intervals. A) Seroprevalence in the years 2009, 2013, and 2017 based on age in 2009. Within each birth cohort, only a marginal increase in seroprevalence is observable from 2009 to 2013 and from 2013 to 2017. The gap is most prominent in the youngest age group. B) Seroprevalence in the years 2009, 2013, and 2017 based on age in 2009, 2013, and 2017, respectively. Holding age fixed (in 2009, 2013, and 2017), the estimated prevalence for persons over age 23 years was lower in 2013 than in 2009 and lower in 2017 than in 2013.
Figure 5.
Figure 5.
Estimated annual basic reproduction number (R0) for dengue (A) and reconstructed annual dengue seroprevalence (B) in Singapore, 1960–2020. Solid lines represent the point estimates, and shaded regions represent 95% Bayesian credible intervals.
Figure 6.
Figure 6.
Estimated age-specific dengue seroprevalence in Singapore in 2017, modeled from 4 hypothetical circumstances: force of infection (FOI) fixed at the 1960s, 1970s, 1980s, and 1990s averages, respectively. The black line represents the age-specific seroprevalence in 2017 based on the original FOI estimates. Of the 4 hypothetical situations, the largest number of dengue infections averted occurs when the FOI is held fixed at the 1960s average (3.12 million; 95% Bayesian credible interval (BCrI): 2.94, 3.27), assuming that numbers of primary and subsequent dengue infections are similar. For scenarios where FOI is held fixed at the 1970s, 1980s, and 1990s averages, the numbers of dengue infections averted are estimated to be 1.90 million (95% BCrI: 1.63, 2.14), 0.87 million (95% BCrI: 0.61, 1.13), and −0.11 million (95% BCrI: −0.30, 0.07), respectively.

References

    1. World Health Organization Dengue and severe dengue. (Fact sheet no. 117). 2017. http://www.who.int/mediacentre/factsheets/fs117/en/. Accessed October 30, 2017.
    1. World Health Organization Global Strategy for Dengue Prevention and Control, 2012–2020 Geneva, Switzerland: World Health Organization; 2012. http://www.who.int/denguecontrol/9789241504034/en. Accessed October 30, 2017.
    1. Suaya JA, Shepard DS, Beatty ME Dengue: burden of disease and costs of illness. (Working paper 32). In: Report of the Scientific Working Group on Dengue, Geneva, 1–5 October 2006 Geneva, Switzerland: World Health Organization; 2007:35–49.
    1. Standish K, Kuan G, Avilés W, et al. . High dengue case capture rate in four years of a cohort study in Nicaragua compared with national surveillance data. PLoS Negl Trop Dis. 2010;4(3):e633. - PMC - PubMed
    1. Wichmann O, Yoon IK, Vong S, et al. . Dengue in Thailand and Cambodia: an assessment of the degree of underrecognized disease burden based on reported cases. PLoS Negl Trop Dis. 2011;5(3):e996. - PMC - PubMed

Publication types

Substances