. 2019 May 7;20(1):344.
doi: 10.1186/s12864-019-5709-y.

Improved annotation of the domestic pig genome through integration of Iso-Seq and RNA-seq data

Affiliations

Improved annotation of the domestic pig genome through integration of Iso-Seq and RNA-seq data

H Beiki et al. BMC Genomics. .

Abstract

Background: Our understanding of the pig transcriptome is limited. RNA transcript diversity among nine tissues was assessed using poly(A) selected single-molecule long-read isoform sequencing (Iso-seq) and Illumina RNA sequencing (RNA-seq) from a single White cross-bred pig.

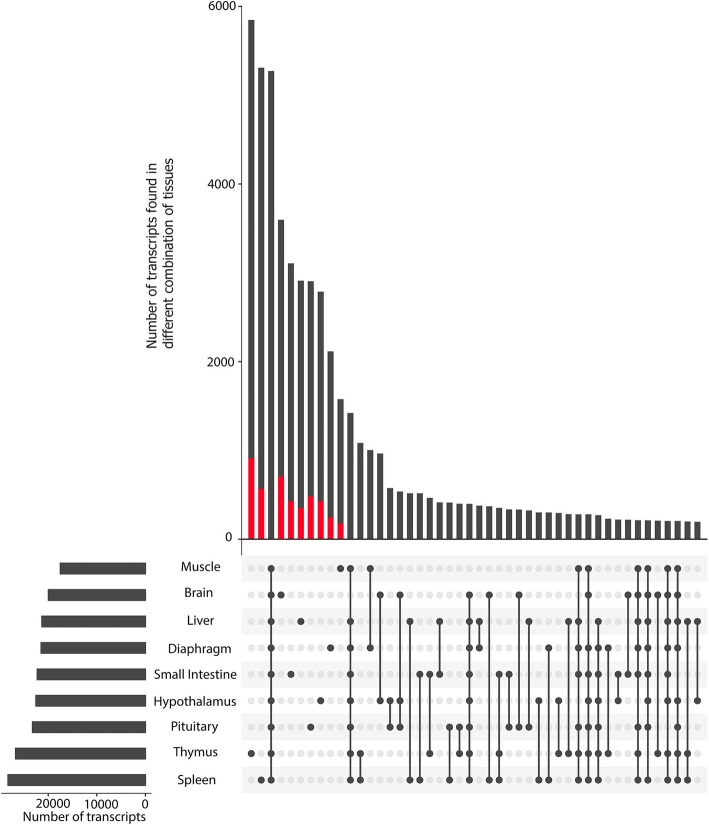
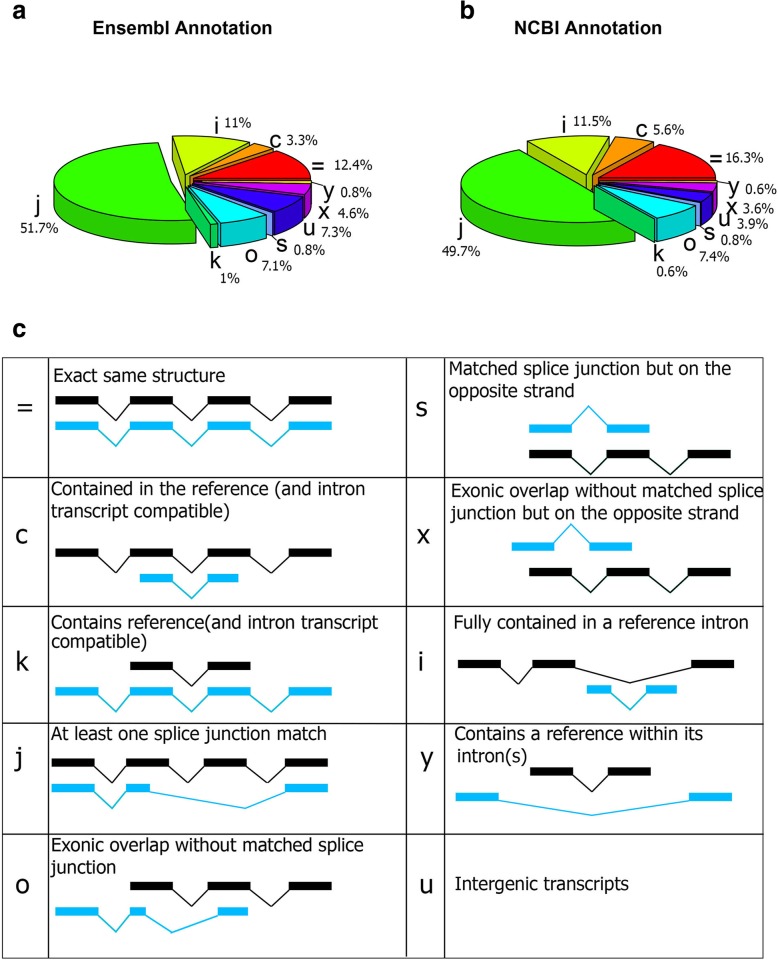
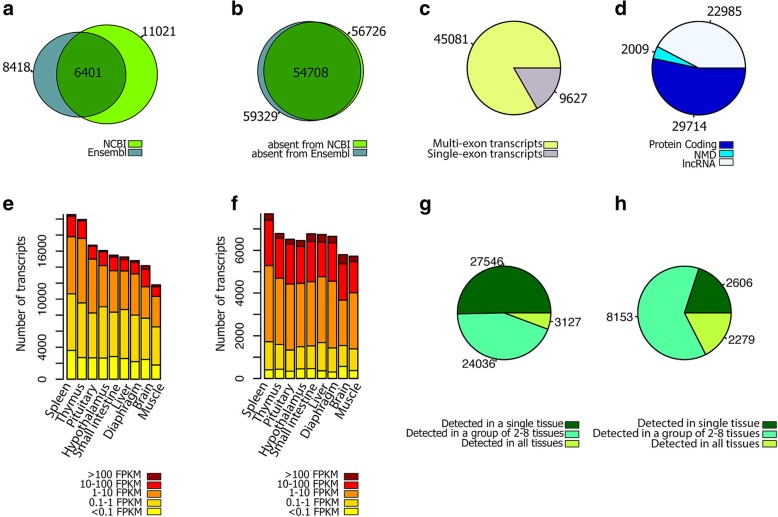
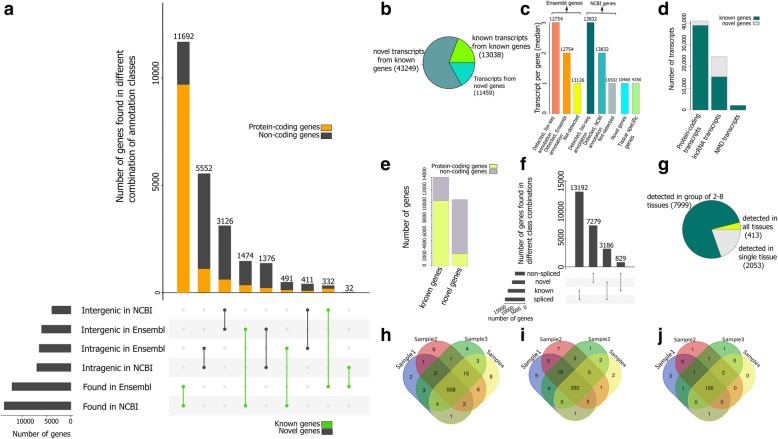
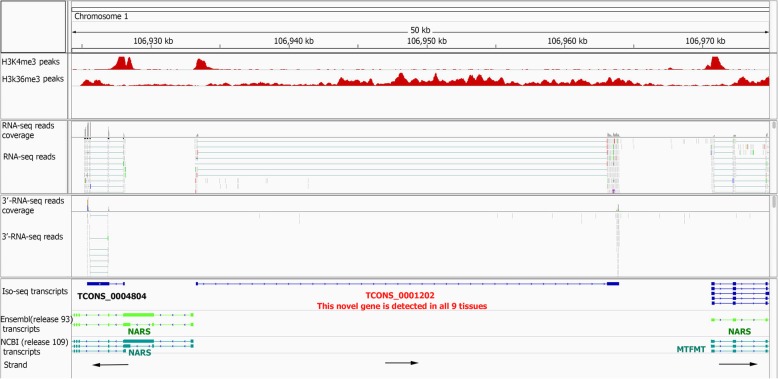
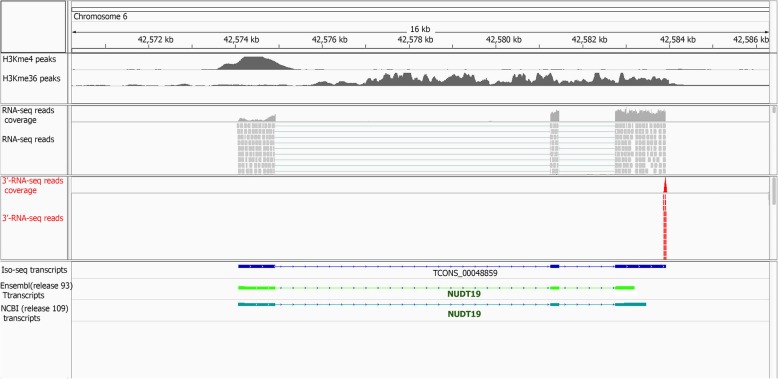
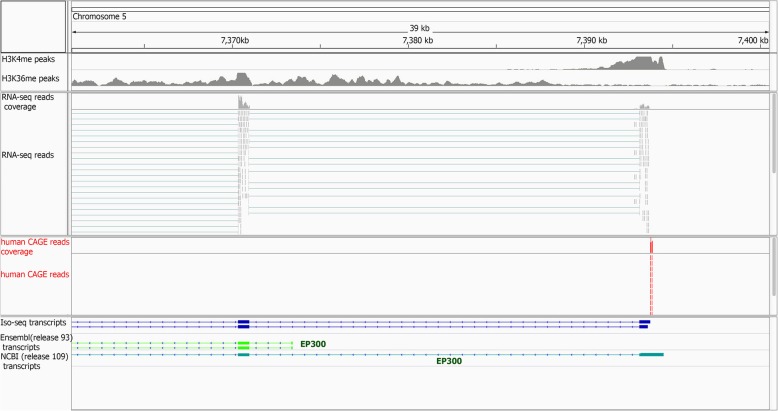
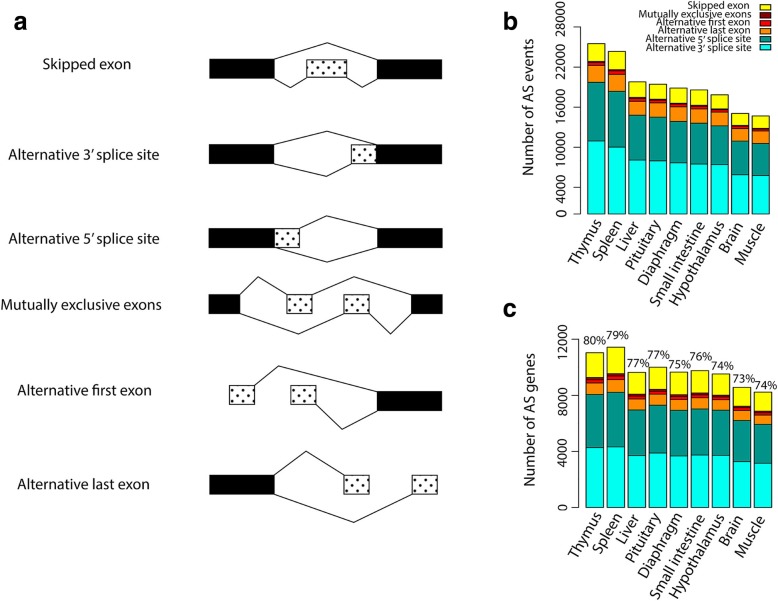
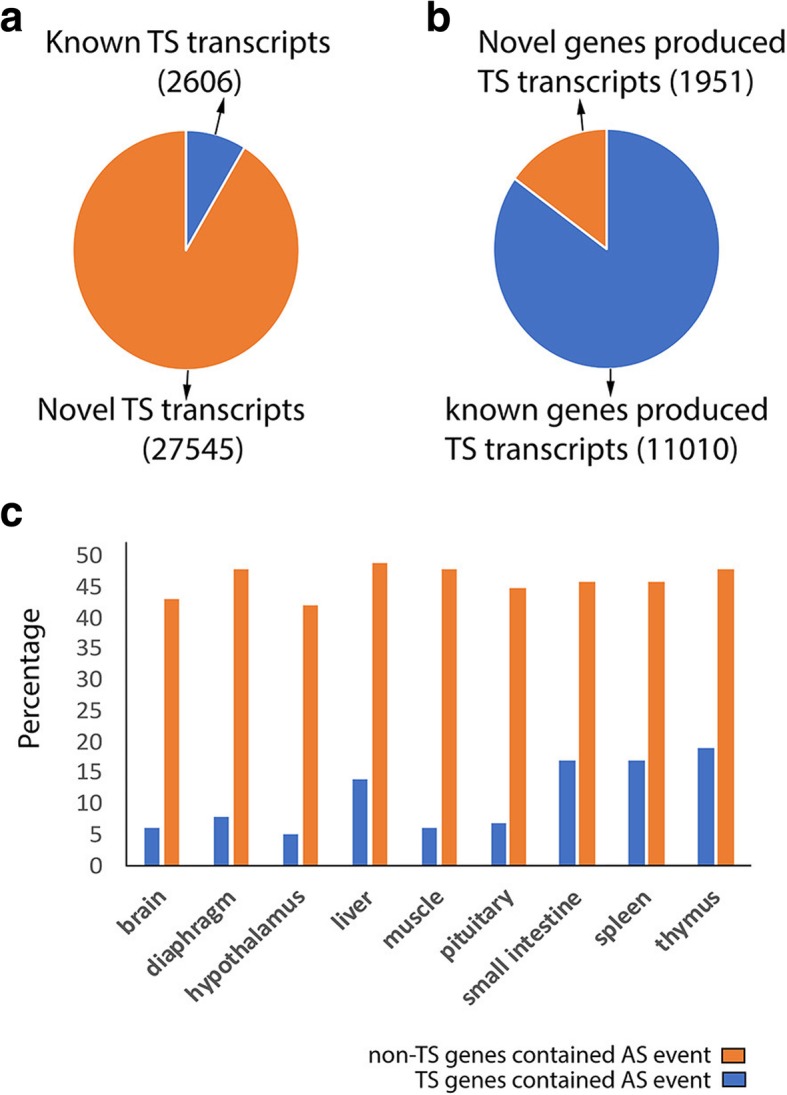
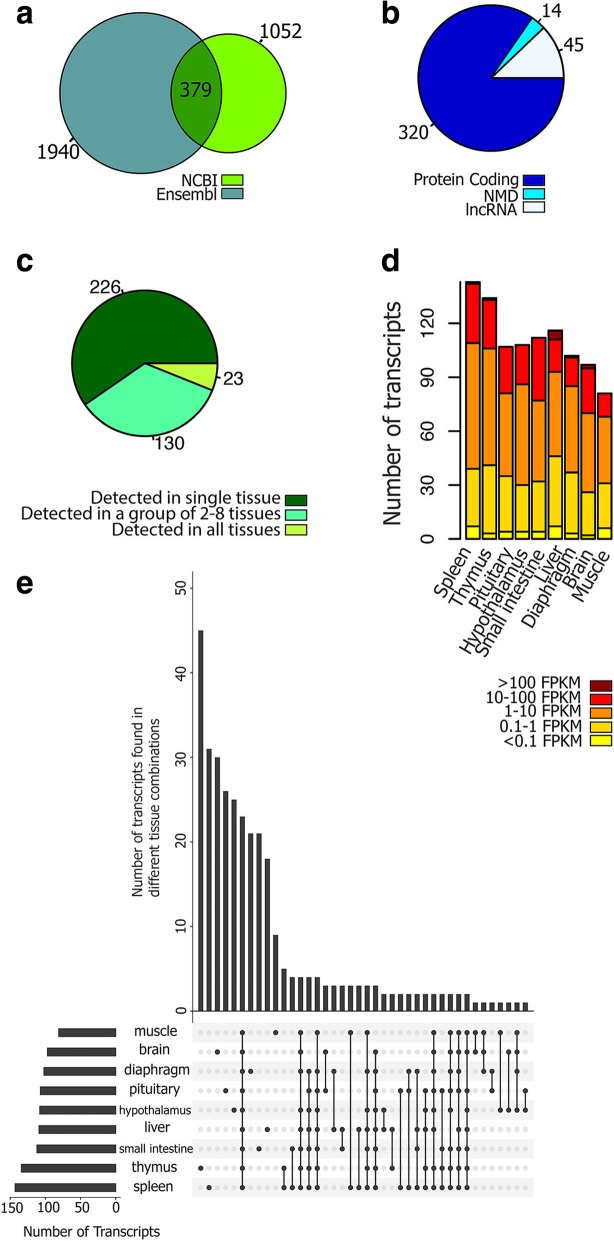
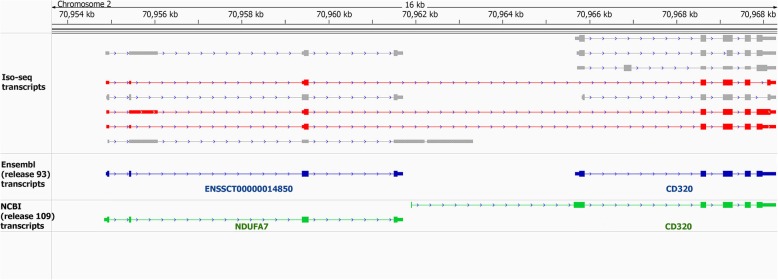
Results: Across tissues, a total of 67,746 unique transcripts were observed, including 60.5% predicted protein-coding, 36.2% long non-coding RNA and 3.3% nonsense-mediated decay transcripts. On average, 90% of the splice junctions were supported by RNA-seq within tissue. A large proportion (80%) represented novel transcripts, mostly produced by known protein-coding genes (70%), while 17% corresponded to novel genes. On average, four transcripts per known gene (tpg) were identified; an increase over current EBI (1.9 tpg) and NCBI (2.9 tpg) annotations and closer to the number reported in human genome (4.2 tpg). Our new pig genome annotation extended more than 6000 known gene borders (5' end extension, 3' end extension, or both) compared to EBI or NCBI annotations. We validated a large proportion of these extensions by independent pig poly(A) selected 3'-RNA-seq data, or human FANTOM5 Cap Analysis of Gene Expression data. Further, we detected 10,465 novel genes (81% non-coding) not reported in current pig genome annotations. More than 80% of these novel genes had transcripts detected in > 1 tissue. In addition, more than 80% of novel intergenic genes with at least one transcript detected in liver tissue had H3K4me3 or H3K36me3 peaks mapping to their promoter and gene body, respectively, in independent liver chromatin immunoprecipitation data.

Conclusions: These validated results show significant improvement over current pig genome annotations.

Keywords: Genome annotation; Iso-seq; PacBio; Porcine; RNA-seq; Single molecule long read sequencing; Transcriptome sequencing.


Conflict of interest statement

Ethics approval and consent to participate

The cross-bred pig used for genome sequencing, and transcriptome sequencing by both PacBio IsoSeq and Illumina RNA-seq technologies were from USMARC. Protocols for use, care and handling pigs were approved by IACUCs at Iowa State University or USMARC. Pigs used to generate the unpublished sequencing data were maintained in Iowa State University or USMARC.

Consent for publication

Not applicable.

Competing interests

All authors declare that they have no competing interests.

Publisher’s Note

Springer Nature remains neutral with regard to jurisdictional claims in published maps and institutional affiliations.

Figures

Fig. 1
Fig. 1
Number of detected transcripts in each tissue and their intersections with other tissues using UpSetR [65]. Red color identifies the proportion of tissue-specific (TS) transcripts that are produced by non-TS genes
Fig. 2
Fig. 2
Comparision of PacBio transcript structure with known transcripts in Ensembl (a) and NCBI (b) genome annotations. (c) Exploratory key to different comparisons. Reference and predicted Iso-seq transcripts are identified by black and blue color, respectively
Fig. 3
Fig. 3
Venn diagram of known (a) and novel (b) PacBio transcripts based on Ensembl and NCBI annotations. (c) Classification of PacBio transcripts to spliced and non-spliced transcripts. (d) Novel transcripts biotypes. Expression level of known (e) and novel (f) transcripts across different tissues. Classification of known (g) and novel (h) transcripts based on the number of tissues in which they were detected
Fig. 4
Fig. 4
(a) Classification of predicted Iso-seq genes into known, novel-intergenic and novel-intragenic genes using Ensembl (release93) and NCBI (release 109) Sscrofa11.1 annotations by UpSetR [65]. Proportion of protein-coding genes in each class is identified by “orange” color. Intersections related to annotated genes are identified by “green” lines. (b) Distribution of transcripts across different classes of predicted genes. (c) Comparison of predicted and annotated genes in term of average number of produced transcripts. Number of genes in each class is shown on each bar. (d) Proportion of transcripts produced by novel and known genes in different transcript biotypes. (e) Gene biotypes. (f) Classification of genes into spliced and un-spliced genes using UpSetR [65]. (g) Classification of novel genes based on the number of tissues in which they were detected. (h) Validation of novel-intergenic genes detected in liver tissue by an independent liver chromatin immunoprecipitation (ChIP) sequencing experiment (2 histone modifications per sample). Venn diagram shows the distribution of 616 validated genes (with significant H3K4m3e and H3K36me3 peaks) across samples. (i) validation of NCBI specific Iso-seq genes that were located in intergenic region of pig genome based on Ensembl gene set (see text) detected in liver tissue by an independent liver ChIP sequencing experiment (2 histone modifications per sample). Venn diagram shows the distribution of 358 validate genes (with significant H3K4m3e and H3K36me3 peaks) across samples. (j) validation of liver detected Ensembl specific Iso-seq genes that were located in intergenic region of pig genome based on Ensembl gene set (see text) by an independent liver ChIP sequencing experiment (2 histone modifications per sample). Venn diagram shows the distribution of 137 validate genes (with significant H3K4m3e and H3K36me3 peaks) across samples
Fig. 5
Fig. 5
Example of validation of novel intergenic Iso-seq gene using matched RNA-seq reads and independent liver ChIP-seq (H3K4me3 and H3K36me3) and 3′-RNA-seq experiments
Fig. 6
Fig. 6
Example of validation of extended 3′ annotation using an independent liver 3′-RNA-seq experiment
Fig. 7
Fig. 7
Example of validation of extended 5′ annotation using an independent Human CAGE data
Fig. 8
Fig. 8
Different types of alternative splicing events and their variations within (a) and across (b) tissues. (c) Distribution of genes containing alternative splicing events within and across tissues. Numbers at the top of each bar showed the percentage of alternative event candidate genes (genes with at least 2 spliced transcripts) exhibiting one or more form of alternative splicing events
Fig. 9
Fig. 9
(a) Classification of tissue-specific (TS) transcripts based on their novelty. (b) Fraction of known and novel genes that produce at least a single TS transcript. (c) Proportion of TS genes and non-TS genes containing alternative splicing events
Fig. 10
Fig. 10
(a) Distribution of transcripts covering more than one known gene across Ensembl and NCBI annotations. (b) biotypes of transcripts with these structure in both Ensembl and NCBI annotations, their classification based on the number of detected tissues (c), their expression level in different tissues (d) and the number of transcripts detected in each tissue and their intersection with other tissues (e) using UpSetR [65]
Fig. 11
Fig. 11
Example of transcripts covering multiple known genes (identified by red color). Predicted protein-coding region in each transcript is identified by thicker lines (see Methods for prediction of coding transcripts)

References

    1. Meurens F, Summerfield A, Nauwynck H, Saif L, Gerdts V. The pig: a model for human infectious diseases. Trends Microbiol. 2012;20:50–57. doi: 10.1016/j.tim.2011.11.002. - DOI - PMC - PubMed
    1. Humphray SJ, Scott CE, Clark R, Marron B, Bender C, Camm N, Davis J, Jenks A, Noon A, Patel M, et al. A high utility integrated map of the pig genome. Genome Biol. 2007;8:R139. doi: 10.1186/gb-2007-8-7-r139. - DOI - PMC - PubMed
    1. Marx H, Hahne H, Ulbrich SE, Schnieke A, Rottmann O, Frishman D, Kuster B. Annotation of the domestic pig genome by quantitative Proteogenomics. J Proteome Res. 2017;16:2887–2898. doi: 10.1021/acs.jproteome.7b00184. - DOI - PubMed
    1. Zerbino DR, Achuthan P, Akanni W, Amode MR, Barrell D, Bhai J, Billis K, Cummins C, Gall A, Giron CG, et al. Ensembl 2018. Nucleic Acids Res. 2018;46:D754–d761. doi: 10.1093/nar/gkx1098. - DOI - PMC - PubMed
    1. Thibaud-Nissen F SA, Murphy T, et al. The Eukaryotic Genome Annotation Pipeline. 2013 Nov 14. In: The NCBI Handbook [Internet]. 2nd edition. Bethesda (MD): National Center for Biotechnology Information (US); 2013-. Available from: https://www.ncbi.nlm.nih.gov/genome/annotation_euk/process/. Accessed 14 Nov 2013.

LinkOut - more resources