. 2019 May 20;8(5):bio042754.
doi: 10.1242/bio.042754.

Defining the dynamic chromatin landscape of mouse nephron progenitors

Affiliations

Defining the dynamic chromatin landscape of mouse nephron progenitors

Sylvia Hilliard et al. Biol Open. .

Abstract

Six2+ cap mesenchyme cells, also called nephron progenitor cells (NPC), are precursors of all epithelial cell types of the nephron, the filtering unit of the kidney. Current evidence indicates that perinatal 'old' NPC have a greater tendency to exit the progenitor niche and differentiate into nascent nephrons than their embryonic 'young' counterpart. Understanding the underpinnings of NPC development may offer insights to rejuvenate old NPC and expand the progenitor pool. Here, we compared the chromatin landscape of young and old NPC and found common features reflecting their shared lineage but also intrinsic differences in chromatin accessibility and enhancer landscape supporting the view that old NPC are epigenetically poised for differentiation. Annotation of open chromatin regions and active enhancers uncovered the transcription factor Bach2 as a potential link between the pro-renewal MAPK/AP1 and pro-differentiation Six2/b-catenin pathways that might be of critical importance in regulation of NPC fate. Our data provide the first glimpse of the dynamic chromatin landscape of NPC and serve as a platform for future studies of the impact of genetic or environmental perturbations on the epigenome of NPC.

Keywords: ATAC-seq; ChIP-seq; Epigenetics; Kidney; Nephrogenesis.


Conflict of interest statement

Competing interestsThe authors declare no competing or financial interests.

Figures

Fig. 1.
Fig. 1.
Assessment of mouse nephron progenitor cell (NPC) diversity. (A) Schematic of the nephrogenic niche and compartments of the cap mesenchyme based on expression of Cited1 and Six2. (B) Kidney tissue section from E16.5 Six2GC mouse co-stained with Six2 and GFP antibodies. High levels of Six2/GFP are present in the cap mesenchyme whereas low levels are observed in the pre-tubular aggregate. UB, ureteric bud; CM, cap mesenchyme; PTA, pre-tubular aggregate; RV, renal vesicle. (C) Isolation of Six2GFP NPC from Six2GC mouse kidneys by FACS. (D–G) Single-cell RNA seq of E16.5 Six2GFP NPC. (D) tSNE plot showing ten cell clusters; (E) Heatmap with the expression pattern of the top five cluster-specific genes in the ten clusters shown in D. (F) Violin plots showing the expression pattern of progenitor markers, Cited1 and Six2, and the differentiation marker Lhx1. (G) Feature plot of Six2 (marker of cap mesenchyme) and Lhx1 (marker of differentiating NPC). Cells with high expression of Six2 are in red and the cells with high expression of Lhx1 are in blue. Cells with high expression of both Six2 and Lhx1 are in green. The FeaturePlot function in Seurat R that shows co-expression of these two genes was used to generate this plot. There is little if any overlap seen in expression pattern.
Fig. 2.
Fig. 2.
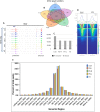
Profiling of open (accessible) chromatin regions during NPC maturation by ATAC-seq. (A) Representative ATAC-seq profiles of biological replicates from young (E13, E16) and old (P0, P2) NPC. P0-H and P0-L represent GFPhigh and GFPlow perinatal NPC. (B) Venn diagram of ATAC-seq peaks per age group. (C) Number of ATAC peaks separated into promoter (±1 kb transcription start site) and distal genomic regions (−1 to −60 kb) in NPC of various ages. (D) Heatmap of ATAC peaks in the −1 to +1 kb around TSS in annotated genes at E16 and P2 NPC. (E) Distribution of ATAC peaks per genomic region in NPC of various ages.
Fig. 3.
Fig. 3.
Differential chromatin accessibility in embryonic (E16) and postnatal (P2) NPC. Heatmap (A), Principal Component Analysis (B) and MA plot (C) of ATAC-seq peaks in E16 versus P2 NPC. (D, E) Heatmaps showing differential chromatin accessibility at the Six2 and HNF1b loci at E16 versus P2 NPC. Red represents gain, whereas blue represents loss of open chromatin regions. (F) Open chromatin profiles correlate with expression of progenitor and differentiation genes during NPC maturation. The tracks represent ATAC-seq, whereas the bar graphs represent RNA-seq. RNA seq (fold change) were obtained from O'Brien et al. (2018). (G) GO functional annotation of ATAC peaks by GREAT analysis in E16 and P2 NPC.
Fig. 4.
Fig. 4.
Differential chromatin accessibility in progenitor Six2GFP(high) (P0-H) and differentiating Six2GFP(low) (P0-L) NPC. Heatmap (A), Principal Component Analysis (B) and MA plot (C) of ATAC-seq peaks in P0-H versus P0-L NPC. (D) Heatmap of ATAC peaks in the −1 to +1 kb around TSS in annotated genes at P0-H and P0-L NPC. (E) Heatmap showing differential chromatin accessibility of selected differentiation genes in P0-H versus P0-L NPC. Red represents gain, whereas blue represents loss of open chromatin regions. (F,G) ATAC-seq tracks comparing P0-H and P0-L NPC in the HNF1b and NCam1 loci. Grey colored boxes highlight gain of open chromatin in P0-L versus P0-H. (H) GO functional annotation of ATAC peaks by GREAT analysis in P0-H and P0-L NPC.
Fig. 5.
Fig. 5.
Schematic of isolation of Cited1+-enriched NPC using Magnetic-Activated Cell Sorting (MACS).
Fig. 6.
Fig. 6.
ChIP-seq profiling of histone modifications in E13 and P0 NPC. E13 and P0 NPC were isolated by Magnetic Activated Cell Sorting (MACS) then cultured in nephron progenitor expansion medium (NPEM) for two passages to enrich for Cited1+ NPC before they were subjected to ChIP-seq. (A) Poised differentiation genes are marked by bivalent H3K4me1/H3K27me3 marks. (B) ChIP-seq peaks representing putative active enhancers in the Lef1 gene show differential gain in P0 versus E13 NPC (grey bars). The promoter region of the Lef1 gene is occupied by bivalent H3K27me3/K4me1 peaks (grey box with black outline). In C, broad regions of repressive H3K27me3-marked chromatin cover the gene bodies of non-lineage genes.
Fig. 7.
Fig. 7.
ChIP-seq profiling of histone modifications in E13 and P0 NPC reveal active enhancer gain with age. (A) (top) Venn diagrams of unique and shared H3K4me1 and H3K27ac active regions (top); (bottom) affinity binding analysis performed on the shared regions reveals a net gain of active H3K27-marked enhancers in P0 NPC. (B) GREAT analysis of the unique active enhancers in E13 versus P0 NPC reveals age-dependent biological processes. (C) HOMER analysis at E13 and P0 active enhancers defines distinct sets of enriched motifs in E13 and P0 NPC and reveals age-related gain of Bach2 and AP1 motifs.
Fig. 8.
Fig. 8.
Open chromatin profiles correlate with transcription factor binding at annotated and putative enhancers of NPC developmental regulators. (A) IGV tracks showing integration of ATAC-seq and ChIP-seq peaks in promoters and enhancers of the progenitor genes, Osr1, Gas1 and Gdnf. (B) ATAC/ChIP signature of genes found in genome-wide association studies of estimated glomerular filtration rate to demonstrate preferential mapping of associated variants to regulatory regions in kidney but not extra-renal tissues (Pattaro et al., 2016).

References

    1. Adli M., Parlak M., Li Y. and El-Dahr S. S. (2015). Epigenetic States of nephron progenitors and epithelial differentiation. J. Cell. Biochem. 116, 893-902. 10.1002/jcb.25048 - DOI - PMC - PubMed
    1. Barak H., Huh S.-H., Chen S., Jeanpierre C., Martinovic J., Parisot M., Bole-Feysot C., Nitschke P., Salomon R., Antignac C. et al. (2012). FGF9 and FGF20 maintain the stemness of nephron progenitors in mice and man. Dev. Cell 22, 1191-1207. 10.1016/j.devcel.2012.04.018 - DOI - PMC - PubMed
    1. Brown A. C., Muthukrishnan S. D., Guay J. A., Adams D. C., Schafer D. A., Fetting J. L. and Oxburgh L. (2013). Role for compartmentalization in nephron progenitor differentiation. Proc. Natl. Acad. Sci. USA 110, 4640-4645. 10.1073/pnas.1213971110 - DOI - PMC - PubMed
    1. Brown A. C., Muthukrishnan S. D. and Oxburgh L. (2015). A synthetic niche for nephron progenitor cells. Dev. Cell 34, 229-241. 10.1016/j.devcel.2015.06.021 - DOI - PMC - PubMed
    1. Brunskill E. W., Park J.-S., Chung E., Chen F., Magella B. and Potter S. S. (2014). Single cell dissection of early kidney development: multilineage priming. Development 141, 3093-3101. 10.1242/dev.110601 - DOI - PMC - PubMed