. 2019 May 14;3(9):1460-1475.
doi: 10.1182/bloodadvances.2018028878.

Hyperfiltration predicts long-term renal outcomes in humanized sickle cell mice

Affiliations

Hyperfiltration predicts long-term renal outcomes in humanized sickle cell mice

Malgorzata Kasztan et al. Blood Adv. .

Abstract

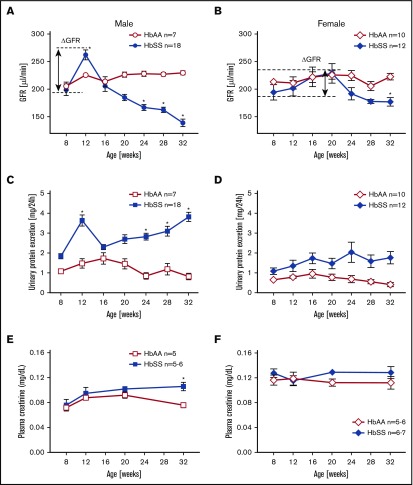
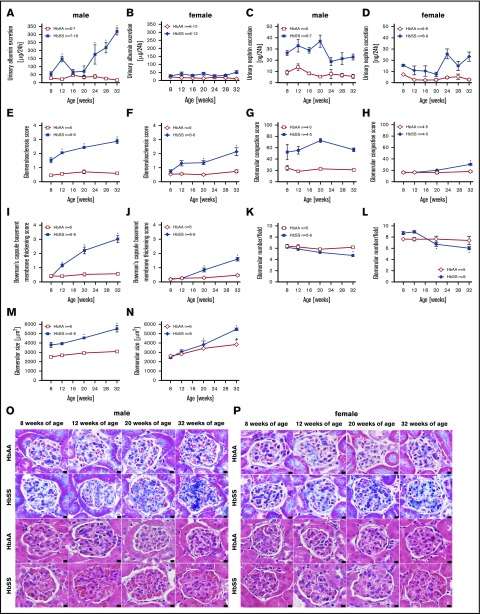
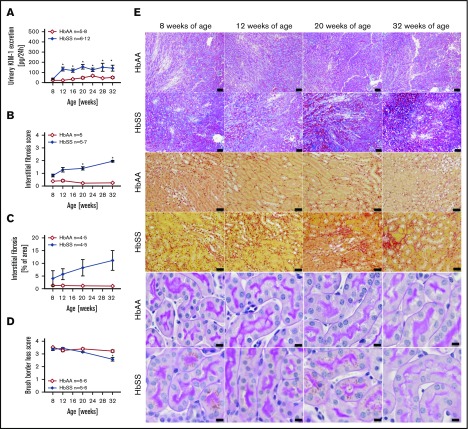
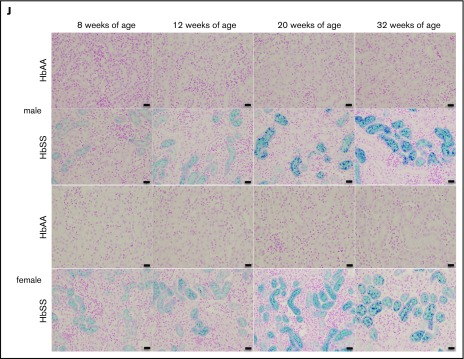
We previously reported that humanized sickle cell (HbSS) mice develop spontaneous nephropathy, a major cause of morbidity and mortality in sickle cell disease (SCD). Because sex-dependent protective mechanisms in SCD have been reported, we examined the course of nephropathy in male and female HbSS mice to determine contributors and/or predictors of disease severity. In male HbSS mice, glomerular filtration rate was characterized by a rapid onset of hyperfiltration and subsequent progressive decline of renal function over 20 weeks. Early tubular injury presented with increased excretion of kidney injury marker 1 (KIM-1), progressive loss of tubular brush border, and interstitial fibrosis that preceded the onset of glomerular damage, suggesting a tubuloglomerular mechanism of kidney injury in these mice. Additionally, we observed a strong association between the magnitude of hyperfiltration and the degree of long-term kidney injury in male HbSS mice. Unlike males, female HbSS mice did not demonstrate a significant loss of renal function or severe kidney damage during the time course of the study. These results suggest that magnitude of hyperfiltration predicts the onset of chronic kidney damage in male HbSS mice, whereas protective mechanisms in female HbSS mice delay the onset of SCD nephropathy.


Conflict of interest statement

Conflict-of-interest disclosure: The authors declare no competing financial interests.

Figures

None
Graphical abstract
Figure 1.
Figure 1.
Longitudinal assessment of kidney function in male and female HbSS and HbAA mice. Trajectory of glomerular filtration rate (GFR) in male (A) and female (B) genetic control (HbAA) and HbSS mice. Trajectory of urinary protein excretion in male (C) and female (D) HbAA and HbSS mice. Plasma creatinine in male (E) and female (F) HbAA and HbSS mice. Data are mean ± SEM; *P < .05 vs 8-week HbSS mice; Analysis by 1-way ANOVA with repeated measurements with Tukey post hoc analysis. (A) Genotype and age, P < .0001. (B) Genotype, P = .0030; age, P = .0040. (C) Genotype, P = .0155; age, P = .0196. (D) Genotype, P < .0001; age, P = .5008, or 2-way ANOVA with the Tukey post hoc test. (E) Interaction, P = .1899; genotype, P = .0078; age, P = .0069. (F) Interaction, P = .5871; genotype, P = .9415; age, P = .0899.
Figure 2.
Figure 2.
Measures of glomerular injury in male and female HbSS and HbAA mice. Trajectory of urinary albumin excretion in male (A) and female (B) HbAA and HbSS mice. Trajectory of urinary nephrin excretion in male (C) and female (D) HbAA and HbSS mice. Quantification of glomerulosclerosis represented as sclerosis index score in male (E) and female (F) HbAA and HbSS mice. Quantification of glomerular vascular congestion represented as the sum of the glomerular congestion index score in male (G) and female (H) HbAA and HbSS mice. Quantification of the Bowman's capsule basement membrane thickening score in male (I) and female (J) HbAA and HbSS mice. Number of glomeruli per field in male (K) and female (L) HbAA and HbSS mice. Glomerular size represented as mean area of glomeruli from male (M) and female (N) HbAA and HbSS mice. (O) Representative Masson trichrome– and hematoxylin and eosin–stained sections of glomeruli from male HbAA and HbSS mice. Original magnification ×40; scale bar = 50 μm. (P) Representative Masson trichrome– and hematoxylin and eosin—stained sections of glomeruli from female HbAA and HbSS mice. Original magnification ×40; scale bars = 50 μm. Data are mean ± SEM; *P < .05 vs 8-week HbSS mice. Analysis by 1-way ANOVA with repeated measurements with Tukey post hoc analysis. (A) Genotype and age, P < .0001. (B) Genotype, P < .0001; age, P = .9348. (C) Genotype, P < .0001; age, P = .0202. (D) Genotype, P < .0001; age, P = .0279, or 2-way ANOVA with Tukey post hoc test. (E) Interaction, genotype, and age, P < .0001. (F) Interaction, P = .0039; genotype and age, P < .0001. (G) Interaction, P = .3446; genotype, P < .0001; age, P = .2662. (H) Interaction, P = .0003; genotype, P = .0002; age, P < .0001. (I-) Interaction, genotype, and age, P < .0001. (K) Interaction, P = .0571; genotype, P = .0050; age, P = .0038. (L) Interaction, P = .0032; genotype, P = .9450; age, P = .0009. (M) Interaction, P = .0118; genotype and age, P < .0001. (N) Interaction, P = .0005; genotype, P = .0006; age, P = .0001.
Figure 3.
Figure 3.
Data showing the time course of glomerular injury in male and female HbSS and HbAA mice. (A) Quantification of WT-1+–stained glomerular sections from male HbAA and HbSS mice represented as number of WT-1+–stained cells per glomerulus. (B) Relative glomerular podocin expression in glomeruli isolated from male HbAA and HbSS mice. (C) Relative glomerular nephrin expression in glomeruli isolated from male HbAA And HbSS mice. (D) Quantification of WT-1+–stained glomerular sections from female HbAA and HbSS mice represented as number of WT-1+–stained cells per glomerulus. (E) Relative glomerular podocin expression in glomeruli isolated from female HbAA and HbSS mice. (F) Relative glomerular nephrin expression in glomeruli isolated from female HbAA and HbSS mice. (G) Representative WT-1+–stained sections of glomeruli from male and female HbAA and HbSS mice. Original magnification ×40; scale bars = 50 μm. Data are mean ± SEM; *P < .05 vs 8-week HbSS; #P < .05 vs 8-week HbAA. Analysis with 2-way ANOVA with Tukey post hoc analysis. (A) Interaction, genotype, and age, P < .0001. (B) Interaction and age, P < .0001; genotype, P = .4236. (C) Interaction, P = .0028; genotype, P < .0001; age, P = .0739. (D) Interaction and genotype, P < .0001; age, P = .0004. (E) Interaction, P = .2687; genotype, P = .0039; age, P = .0017. (F) Interaction, P = .5020; genotype, P = 9953; age, P = .0411.
Figure 4.
Figure 4.
Measures of renal tubular injury progression in male HbSS mice compared with genetic controls (HbAA). (A) Trajectory of kidney injury marker 1 (KIM-1) in male HbAA and HbSS mice. (B) Quantification of interstitial fibrosis index score in male HbAA and HbSS mice. (C) Quantification of interstitial fibrosis index score in male HbAA and HbSS mice. (D) Quantification of brush border loss index score in male HbAA and HbSS mice. (E) Representative Masson trichrome–, Picro Sirius Red–, and periodic-acid Schiff–hematoxylin-stained sections of renal cortex and medulla from male HbAA and HbSS mice. Original magnification ×10 (scale bars = 100 μm) for Masson trichrome staining and ×40 (scale bars = 50 μm) for Picro Sirius Red and periodic-acid Schiff–hematoxylin stainings. Data are mean ± SEM; *P < .05 vs 8-week HbSS mice. #P < .05 vs 8-week HbAA mice. Analysis by 1-way ANOVA with repeated measurements with Tukey post hoc analysis. (A) Genotype, P < .0001; age, P = .0437, or 2-way ANOVA with Tukey post hoc test. (B) Interaction, P = .0140; genotype, P < .0001; age, P = .2854. (C) Interaction, P = .1065; genotype, P < .0001; age, P = .2016. (D) Interaction, P = .3515; genotype and age, P < .0001.
Figure 5.
Figure 5.
Measures of renal tubular injury progression in female HbSS mice compared with genetic controls (HbAA). (A) Trajectory of KIM-1 in female HbAA and HbSS mice. (B) Quantification of interstitial fibrosis index score in female HbAA and HbSS mice. (C) Quantification of interstitial fibrosis in female HbAA and HbSS mice. (D) Quantification of brush border loss index score in male HbAA and HbSS mice. (E) Representative Masson trichrome–, Picro Sirius Red–, and periodic-acid Schiff–hematoxylin-stained sections of renal cortex and medulla from female HbAA and HbSS mice. Original magnification ×10 (scale bars = 100 μm) for Masson trichrome staining and ×40 (scale bars = 50 μm) for Picro Sirius Red and periodic-acid Schiff–hematoxylin stainings. Data are mean ± SEM; *P < .05 vs 8-week HbSS mice. Analysis by 1-way ANOVA with repeated measurements with Tukey post hoc analysis (A) Genotype, P < .0001; age, P = .0049, or 2-way ANOVA with the Tukey post hoc test. (B) Interaction, P = .0140; genotype, P < .0001; age, P = .2854. (C) Interaction, P = .3947; genotype, P = .0004; age, P = .4610. (D) Interaction, P = .0008; genotype, P < .0001; age, P = .0011.
Figure 6.
Figure 6.
Time course in additional measures of renal tubular injury in male and female HbSS mice compared with genetic controls (HbAA). (A) Relative NGAL expression in renal cortex of male HbAA and HbSS mice. (B) Relative NGAL expression in renal cortex of female HbAA and HbSS mice. (C) Relative megalin expression in renal cortex of male HbAA and HbSS mice. (D) Relative megalin expression in renal cortex of female HbAA and HbSS mice. (E) Quantification of iron deposition in the whole kidney scans (represented as megapixels per micrometer) in male HbAA and HbSS mice. Original magnification ×40; scale bar = 50 μm. (F) Quantification of iron deposition in the whole kidney scans (represented as megapixels per micrometer) in male HbAA and HbSS mice. (G) Relative caspase-3 expression in renal cortex of male HbAA and HbSS mice. (H) Relative caspase-3 expression in renal cortex of female HbAA and HbSS mice. (I) Relative HIF-1α expression in renal cortex of male and females HbSS mice. (J) Representative Prussian blue–stained sections of renal cortex from male and female HbAA and HbSS mice. Original magnification ×10; scale bar = 100 μm. Data are mean plus or minus SEM; *P < .05 vs 8-week HbSS mice; **P < .05 vs age-matched males HbSS. Analysis by 2-way ANOVA with the Tukey post hoc test. (A) Interaction, P = .0099; genotype, P < .0001; age, P = .0097. (B) Interaction, P = .0031; genotype, P < .0001; age, P = .0234. (C) Interaction, P = .0176; genotype, P < .0001; age, P = .0184. (D) Interaction, P = .2074; genotype, P = .0119; age, P = .1529. (E) Interaction, P = .0002; genotype, P < .0001; age, P = .0002. (F) Interaction, P = .4335; genotype, P < .0001; age, P = .1189. (G) Interaction, P = .3509; genotype, P < .0001; age, P = .3981. (H) Interaction, P = .0007; genotype, P < .0001; age, P = .7121, or unpaired Student t test (I).
Figure 6.
Figure 6.
Time course in additional measures of renal tubular injury in male and female HbSS mice compared with genetic controls (HbAA). (A) Relative NGAL expression in renal cortex of male HbAA and HbSS mice. (B) Relative NGAL expression in renal cortex of female HbAA and HbSS mice. (C) Relative megalin expression in renal cortex of male HbAA and HbSS mice. (D) Relative megalin expression in renal cortex of female HbAA and HbSS mice. (E) Quantification of iron deposition in the whole kidney scans (represented as megapixels per micrometer) in male HbAA and HbSS mice. Original magnification ×40; scale bar = 50 μm. (F) Quantification of iron deposition in the whole kidney scans (represented as megapixels per micrometer) in male HbAA and HbSS mice. (G) Relative caspase-3 expression in renal cortex of male HbAA and HbSS mice. (H) Relative caspase-3 expression in renal cortex of female HbAA and HbSS mice. (I) Relative HIF-1α expression in renal cortex of male and females HbSS mice. (J) Representative Prussian blue–stained sections of renal cortex from male and female HbAA and HbSS mice. Original magnification ×10; scale bar = 100 μm. Data are mean plus or minus SEM; *P < .05 vs 8-week HbSS mice; **P < .05 vs age-matched males HbSS. Analysis by 2-way ANOVA with the Tukey post hoc test. (A) Interaction, P = .0099; genotype, P < .0001; age, P = .0097. (B) Interaction, P = .0031; genotype, P < .0001; age, P = .0234. (C) Interaction, P = .0176; genotype, P < .0001; age, P = .0184. (D) Interaction, P = .2074; genotype, P = .0119; age, P = .1529. (E) Interaction, P = .0002; genotype, P < .0001; age, P = .0002. (F) Interaction, P = .4335; genotype, P < .0001; age, P = .1189. (G) Interaction, P = .3509; genotype, P < .0001; age, P = .3981. (H) Interaction, P = .0007; genotype, P < .0001; age, P = .7121, or unpaired Student t test (I).
Figure 7.
Figure 7.
Evidence that the magnitude of hyperfiltration phase correlates with kidney injury only in male, but not female, HbSS mice. (A) The degree of rise in GFR from 8 to 12 weeks (ΔGFR) in male HbAA and HbSS mice. (B) The degree of rise in GFR from 8 to 20 weeks in (ΔGFR) female HbAA and HbSS mice. (C) Correlation of glomerular hyperfiltration (ΔGFR) with urinary protein excretion at 32 weeks of age in male and female HbSS mice. (D) Urinary protein excretion at 32 weeks of age in male HbSS mice with the magnitude of glomerular hyperfiltration <60 μL/min and >60 μL/min. (E) Urinary protein excretion at 32 weeks of age in female HbSS mice with the magnitude of glomerular hyperfiltration <60 μL/min and >60 μL/min. (F) Correlation of glomerular hyperfiltration (ΔGFR) with urinary albumin excretion at 32 weeks of age in male and female HbSS mice. (G) Urinary albumin excretion at 32 weeks of age in male HbSS mice with the magnitude of glomerular hyperfiltration <60 μL/min and >60 μL/min. (H) Urinary albumin excretion at 32 weeks of age in female HbSS mice with the magnitude of glomerular hyperfiltration <60 μL/min and >60 μL/min. (I) Correlation of glomerular hyperfiltration (ΔGFR) with GFR at 32 weeks of age in male and female HbSS mice. (J) GFR at 32 weeks of age in male HbSS mice with the magnitude of glomerular hyperfiltration <60 μL/min and >60 μL/min. (K) GFR at 32 weeks of age in female HbSS mice with the magnitude of glomerular hyperfiltration <60 μL/min and >60 μL/min. (L) Correlation of glomerular hyperfiltration (ΔGFR) with plasma creatinine at 32 weeks of age in male and female HbSS mice. (M) Plasma creatinine at 32 weeks of age in male HbSS mice with the magnitude of glomerular hyperfiltration <60 μL/min and >60 μL/min. (N) Plasma creatinine at 32 weeks of age in female HbSS mice with the magnitude of glomerular hyperfiltration <60 μL/min and >60 μL/min. Data are mean ± SEM; *P < .05 vs ΔGFR <60; **P < .05 vs HbAA mice. Analysis by linear regression (C,F,I,L) or unpaired Student t test (A-B,D-E,G-H,J-K,M-N).

Comment in

References

    1. Guasch A, Navarrete J, Nass K, Zayas CF. Glomerular involvement in adults with sickle cell hemoglobinopathies: Prevalence and clinical correlates of progressive renal failure. J Am Soc Nephrol. 2006;17(8):2228-2235. - PubMed
    1. Nielsen L, Canouï-Poitrine F, Jais JP, et al. . Morbidity and mortality of sickle cell disease patients starting intermittent haemodialysis: a comparative cohort study with non- Sickle dialysis patients. Br J Haematol. 2016;174(1):148-152. - PubMed
    1. McClellan AC, Luthi JC, Lynch JR, et al. . High one year mortality in adults with sickle cell disease and end-stage renal disease. Br J Haematol. 2012;159(3):360-367. - PMC - PubMed
    1. Lanzkron S, Carroll CP, Haywood C Jr. Mortality rates and age at death from sickle cell disease: U.S., 1979-2005. Public Health Rep. 2013;128(2):110-116. - PMC - PubMed
    1. Yawn BP, Buchanan GR, Afenyi-Annan AN, et al. . Management of sickle cell disease: summary of the 2014 evidence-based report by expert panel members. JAMA. 2014;312(10):1033-1048. - PubMed

Publication types