. 2019 Apr 2:2019:2728786.
doi: 10.1155/2019/2728786. eCollection 2019.

Purinergic Signaling Pathway in Human Olfactory Neuronal Precursor Cells

Affiliations

Purinergic Signaling Pathway in Human Olfactory Neuronal Precursor Cells

Héctor Solís-Chagoyán et al. Stem Cells Int. .

Abstract

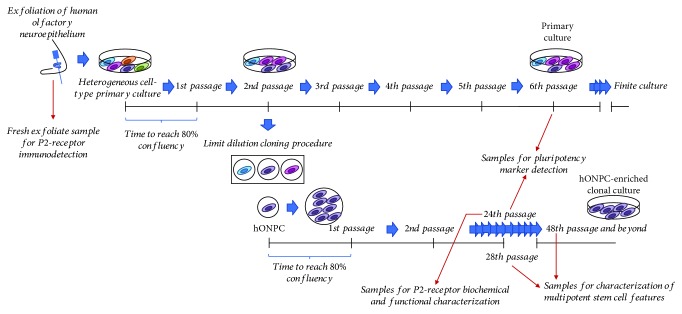
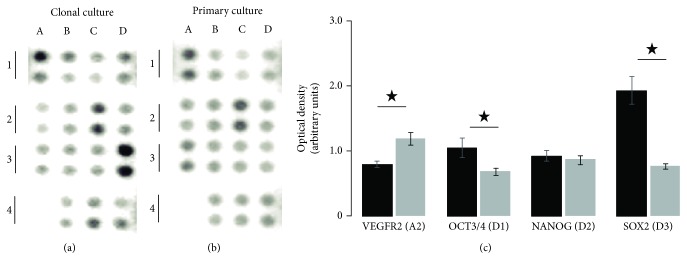
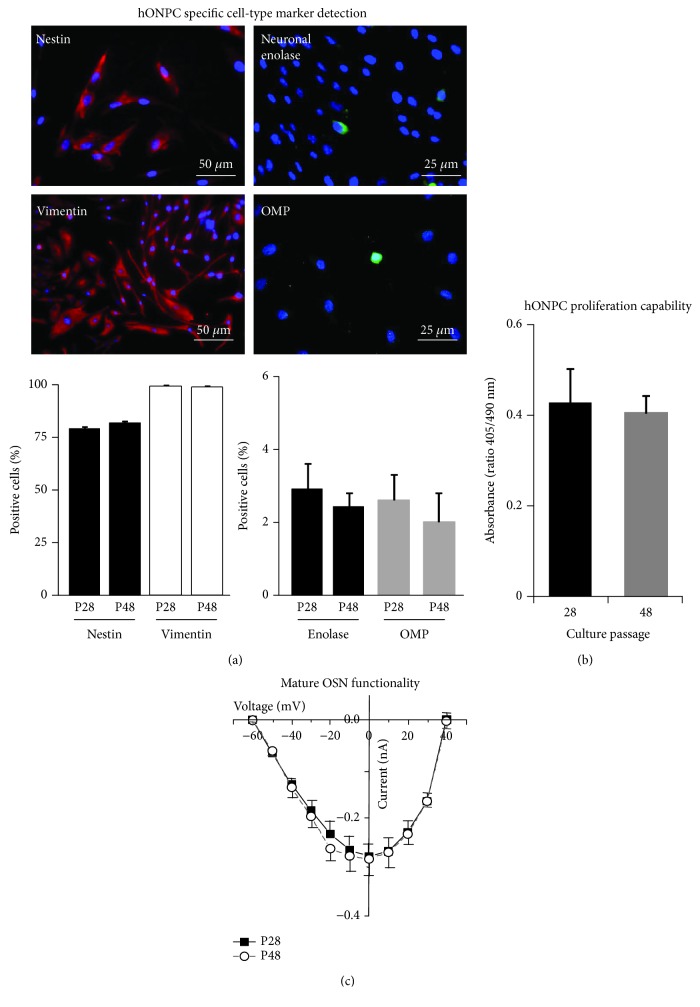
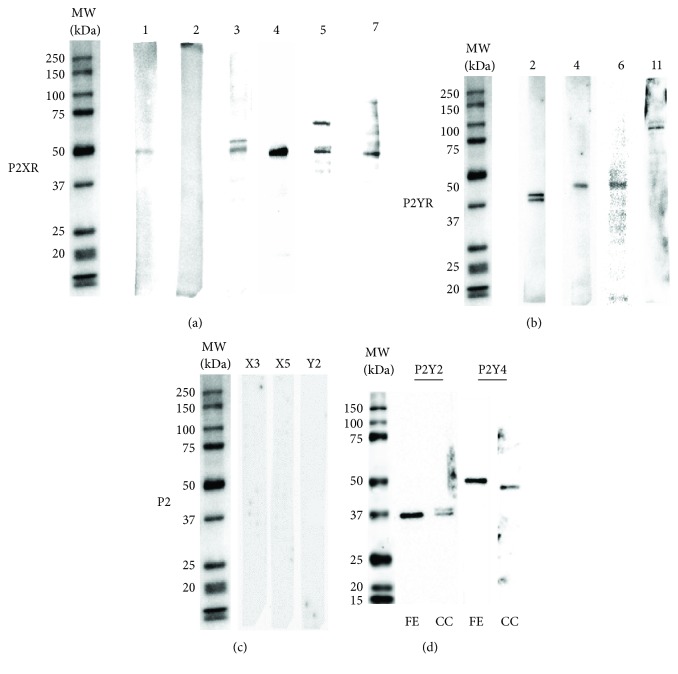
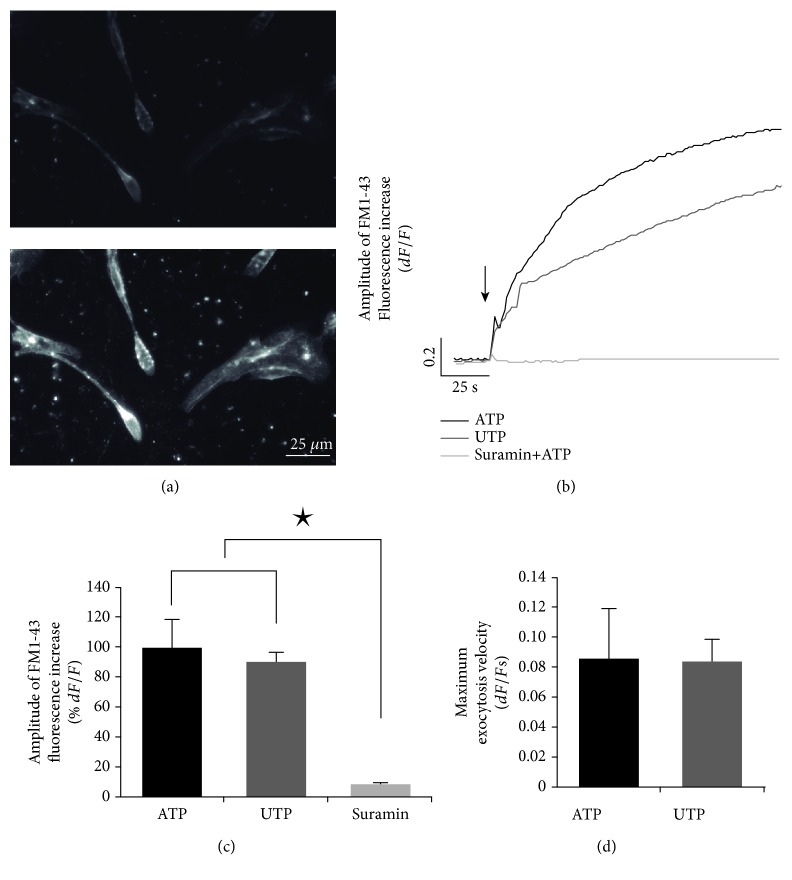
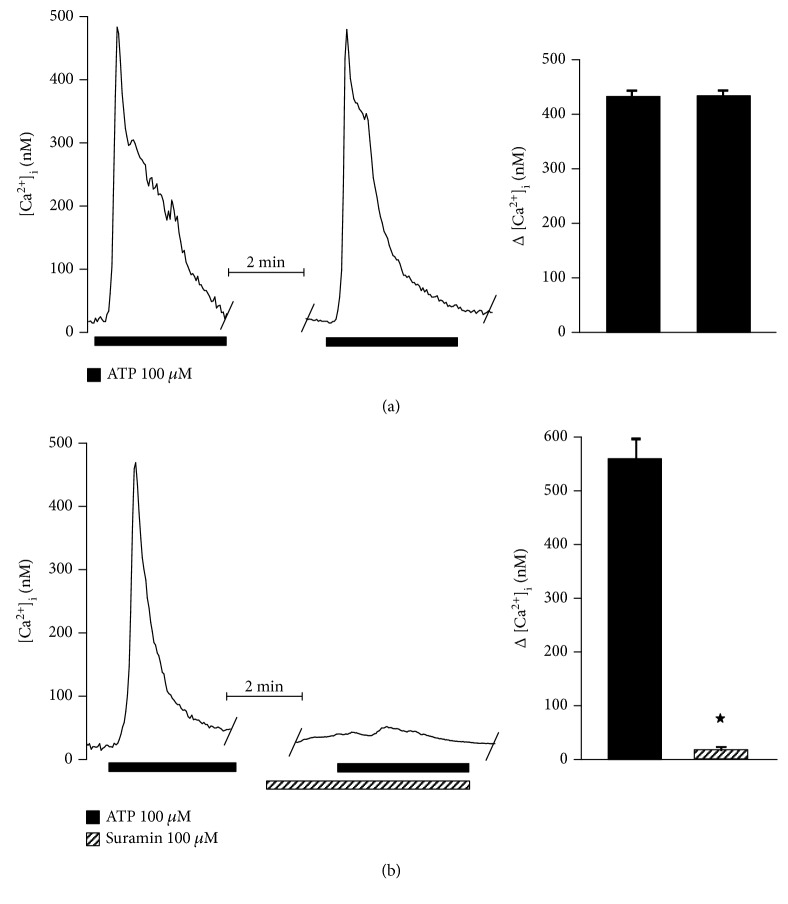
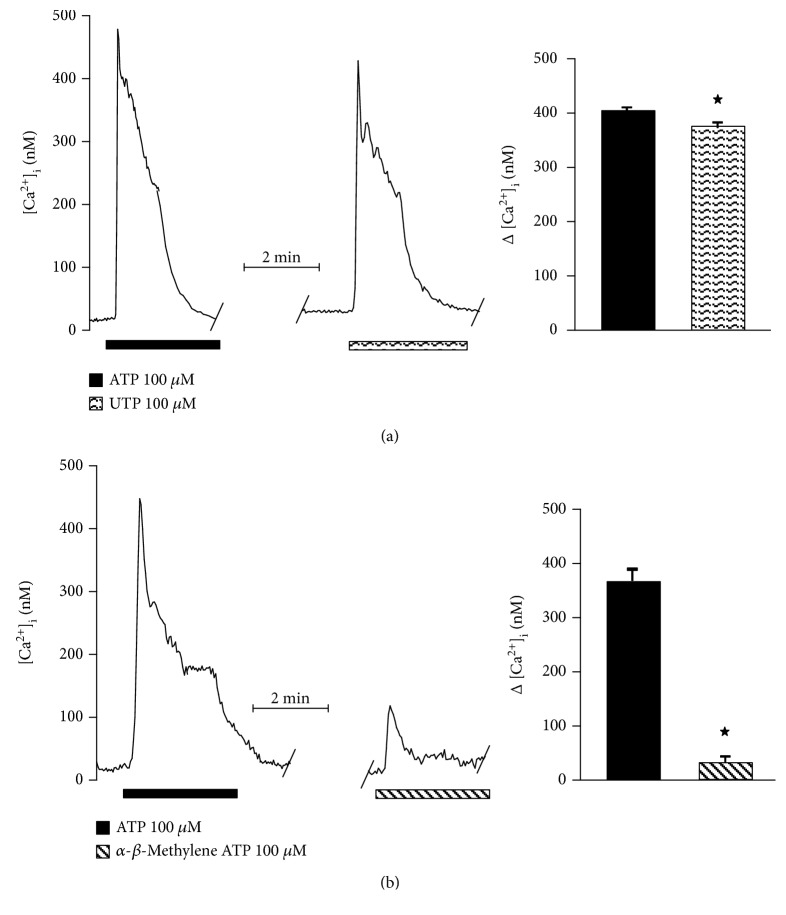
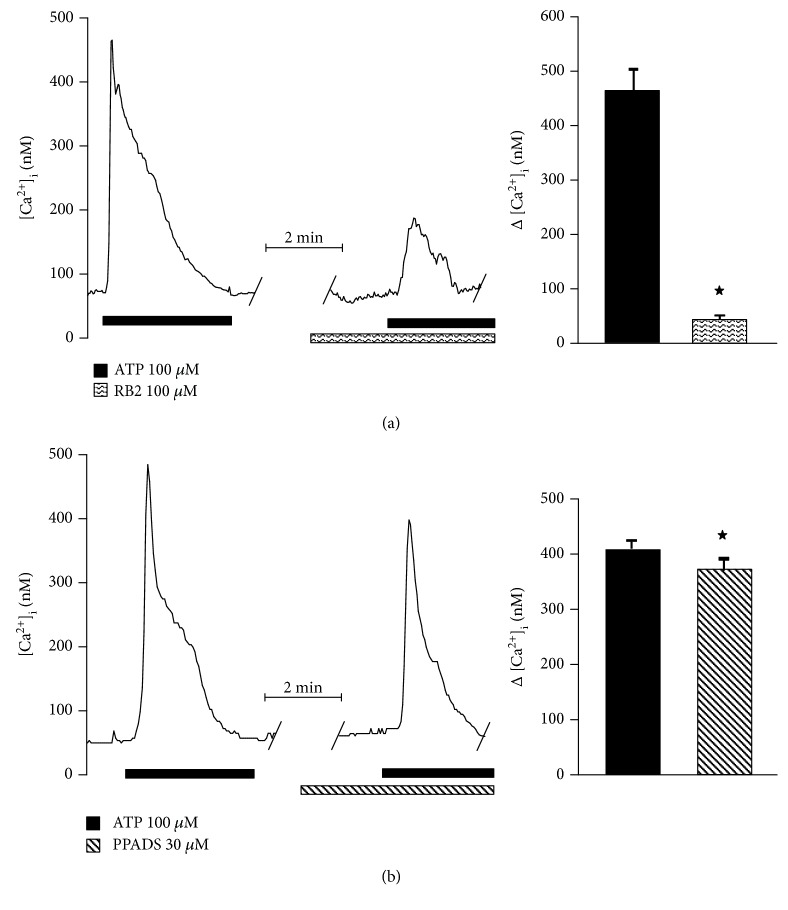
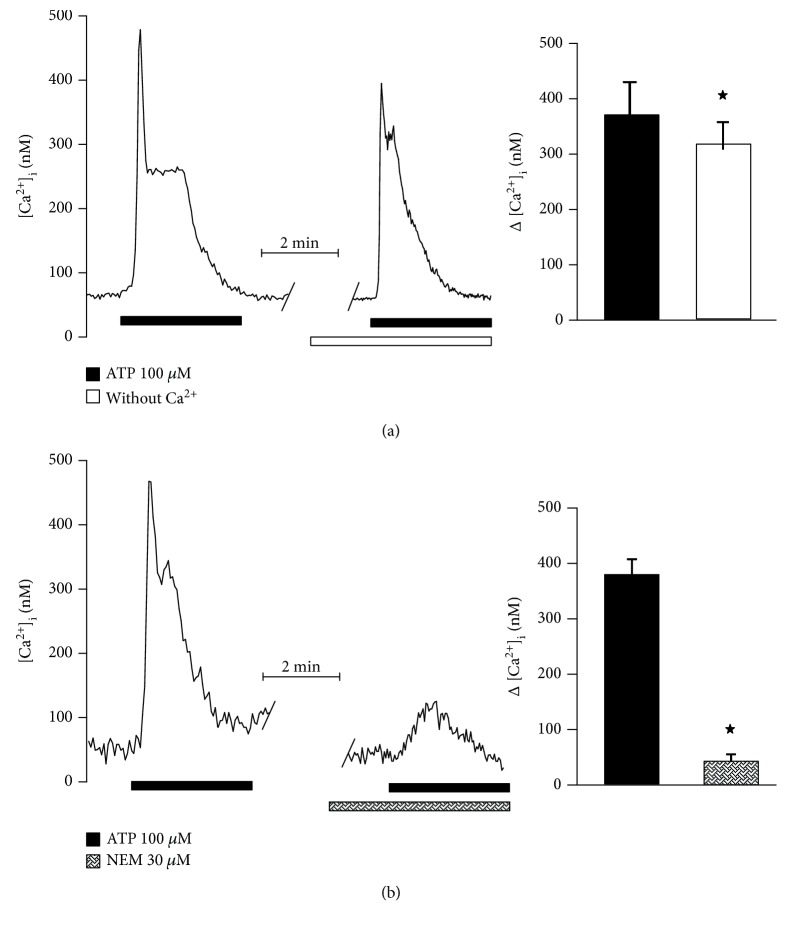
Extracellular ATP and trophic factors released by exocytosis modulate in vivo proliferation, migration, and differentiation in multipotent stem cells (MpSC); however, the purinoceptors mediating this signaling remain uncharacterized in stem cells derived from the human olfactory epithelium (hOE). Our aim was to determine the purinergic pathway in isolated human olfactory neuronal precursor cells (hONPC) that exhibit MpSC features. Cloning by limiting dilution from a hOE heterogeneous primary culture was performed to obtain a culture predominantly constituted by hONPC. Effectiveness of cloning to isolate MpSC-like precursors was corroborated through immunodetection of specific protein markers and by functional criteria such as self-renewal, proliferation capability, and excitability of differentiated progeny. P2 receptor expression in hONPC was determined by Western blot, and the role of these purinoceptors in the ATP-induced exocytosis and changes in cytosolic Ca2+ ([Ca2+]i) were evaluated using the fluorescent indicators FM1-43 and Fura-2 AM, respectively. The clonal culture was enriched with SOX2 and OCT3/4 transcription factors; additionally, the proportion of nestin-immunopositive cells, the proliferation capability, and functionality of differentiated progeny remained unaltered through the long-term clonal culture. hONPC expressed P2X receptor subtypes 1, 3-5, and 7, as well as P2Y2, 4, 6, and 11; ATP induced both exocytosis and a transient [Ca2+]i increase predominantly by activation of metabotropic P2Y receptors. Results demonstrated for the first time that ex vivo-expressed functional P2 receptors in MpSC-like hONPC regulate exocytosis and Ca2+ signaling. This purinergic-triggered release of biochemical messengers to the extracellular milieu might be involved in the paracrine signaling among hOE cells.


Figures

Figure 1
Figure 1
Timeline for cell culture procedures. Cells were obtained by exfoliation of the human olfactory epithelium and cultured in DMEM/F12 medium supplemented with 10% FBS, 2 mM glutamine, and 1% streptomycin-penicillin, at 37°C with 5% CO2. A clonal culture was obtained through the limiting dilution procedure. Red arrows indicate the precise passages from where samples were taken for experiments. hONPC: human olfactory neuronal precursor cell.
Figure 2
Figure 2
Proteome profile of human multipotent stem cell markers. Neuronal precursor cells were isolated from a hOE heterogeneous primary culture by cloning. Cloned cells at passage 24 (a) and primary culture cells at passage 6 (b) were lysed, and 150 μg of total protein was added to each membrane of the antibody array. The optical density of immunopositive spots was quantified by quadruplicate. The proteins corresponding to duplicate spots of the array were as follows: Snail (A1), VEGF R2 (A2), HCG (A3), and negative control (A4); SOX17 (B1), OTX2 (B2), TP63 (B3), and Goosecoid (B4); α-Fetoprotein (C1), GATA-4 (C2), HNF-3β (C3), and PDX-1 (C4); and OCT3/4 (D1), NANOG (D2), SOX2 (D3), and E-cadherin (D4). (c) depicts data comparison for some relevant proteins. Data represent the media ± SEM. Statistical analysis was carried out with a Mann-Whitney U test. p < 0.05.
Figure 3
Figure 3
Characterization of the clonal culture by detection of specific protein markers and functional evaluation of precursor cells. Cloned cells from passages 28 (P28) and 48 (P48) were cultured and processed. In (a), the upper panel shows representative images from P28 cells stained by immunofluorescence. Nuclei were detected with DAPI (blue staining). Lower panels illustrate comparisons of immunopositive cells between passages (n = 18 fields per protein tested). (b) shows the proliferation level assessed through BrdU incorporation into DNA, measured through an ELISA assay (n = 4 wells per passage). (c) shows the evaluation of functionality of mature olfactory sensory neurons (OSN) through recording of voltage-activated Ca2+ currents (VACC) by a patch clamp (8 cells per passage). Data represent the media ± SEM and were compared by Student t test.
Figure 4
Figure 4
Detection of P2 receptors in the clonal culture of the hOE. Cloned cells were scraped with a RIPA buffer, and cell lysates were assayed by Western blot to immunodetect P2 receptor subtypes. Representative chemiluminescent bands corresponding to P2X receptors are shown in (a) and to P2Y receptors in (b). (c) shows antibody specificity controls assessed by omission of primary antibody (P2X3) or by preadsorption of anti-P2X5 and anti-P2Y2 with the corresponding blocking peptides. The molecular weights of sample bands were corroborated using biotinylated molecular weight standards. (d) shows immunodetection of P2Y2 and P2Y4 receptors in both the fresh exfoliate (FE) sample and the clonal culture (CC) from the hOE.
Figure 5
Figure 5
Purinergic-dependent exocytosis in olfactory neuronal precursor cells. Cloned cells were cultured for 3 days, and exocytosis was evaluated using the fluorescent indicator FM1-43. (a) shows human olfactory neuronal precursor cells (hONPC) before stimulus (up) and visible fluorescence augmentation after ATP stimulation (down). (b) depicts the fluorescence mean response kinetics after applying ATP, UTP (P2Y receptor agonist), or suramin (P2 receptor antagonist) plus ATP. The arrow shows the time when stimulus was applied. (c) and (d) show bar graphs comparing responses' amplitude and velocity, respectively. Data represent the media ± SEM and were compared through a one-way ANOVA and a post hoc Tukey test (8 dishes per treatment, 5 cells/dish). p < 0.05.
Figure 6
Figure 6
ATP-induced increase in cytosolic Ca2+ is mediated by P2 receptor activation in precursors from the hOE. Clonal cells were cultured for 3 days to study the change in cytosolic Ca2+ by microfluorometry using the fluorescent indicator Fura-2 AM. Two pulses of ATP were applied with an interstimulus interval of 15 min to determine the response reproducibility (a) (n = 5). (b) shows that the Ca2+ increase induced by ATP was blocked by suramin (n = 5). Data represent the media ± SEM and were compared by a Student t test. p < 0.05.
Figure 7
Figure 7
Participation of P2Y and P2X receptors in the cytosolic Ca2+ increase induced by ATP in olfactory neuronal precursors cells. To determine the specific relative contribution of either P2Y or P2X receptors to the enhancement of cytosolic Ca2+ induced by ATP, specific agonists were applied at the second stimulus and compared with the response to ATP. The response to UTP (P2Y agonist) reached 90% of the ATP response (a) (n = 5), whereas the P2X agonist α-β-methylene ATP only induced 10% of the ATP response (b) (n = 5 cells). Data represent the media ± SEM and were compared through a Student t test. p < 0.05.
Figure 8
Figure 8
Cytosolic Ca2+ increase induced by P2Y and P2X receptor activation is blocked by their antagonist in precursors from the hOE. Cell perfusion with RB2 (P2Y receptors antagonist) blocked 90% of the ATP response (n = 5) (a), whereas PPADS (P2X receptors antagonist) blocked only 10% (n = 5) (b). Data represent the media ± SEM and were compared by a Student t test. p < 0.05.
Figure 9
Figure 9
Contribution of the ionotropic or the metabotropic pathway to the purinoceptor-mediated response to ATP in precursor cells of the hOE. Ionotropic P2X receptors induce an extracellular Ca2+ influx when stimulated, while G-protein coupled P2Y receptors induce release of Ca2+ from the intracellular stores through IP3 stimulation. The contribution of Ca2+ influx through P2X receptors in hOE precursors was determined by perfusing cells with a Ca2+-free solution (a) (n = 5) and stimulating them with ATP. The metabotropic P2Y pathway was blocked using NEM, a G-protein uncoupler (b) (n = 5). The former diminished the response to ATP by 10%, and NEM blocked the response by 90%. Data represent the media ± SEM and were compared with a Student t test. p < 0.05.

References

    1. Gonçalves J. T., Schafer S. T., Gage F. H. Adult neurogenesis in the hippocampus: from stem cells to behavior. Cell. 2016;167(4):897–914. doi: 10.1016/j.cell.2016.10.021. - DOI - PubMed
    1. Tanos T., Saibene A. M., Pipolo C., Battaglia P., Felisati G., Rubio A. Isolation of putative stem cells present in human adult olfactory mucosa. PLoS One. 2017;12(7, article e0181151) doi: 10.1371/journal.pone.0181151. - DOI - PMC - PubMed
    1. Obernier K., Cebrian-Silla A., Thomson M., et al. Adult neurogenesis is sustained by symmetric self-renewal and differentiation. Cell Stem Cell. 2018;22(2):221–234.e8. doi: 10.1016/j.stem.2018.01.003. - DOI - PMC - PubMed
    1. Akers K. G., Martinez-Canabal A., Restivo L., et al. Hippocampal neurogenesis regulates forgetting during adulthood and infancy. Science. 2014;344(6184):598–602. doi: 10.1126/science.1248903. - DOI - PubMed
    1. Powell T. R., Murphy T., Lee S. H., et al. Inter-individual variation in genes governing human hippocampal progenitor differentiation in vitro is associated with hippocampal volume in adulthood. Scientific Reports. 2017;7(1, article 15112) doi: 10.1038/s41598-017-15042-z. - DOI - PMC - PubMed

LinkOut - more resources