. 2019 Jun 6;9(3):20180074.
doi: 10.1098/rsfs.2018.0074. Epub 2019 Apr 19.

Cross-over in the dynamics of polymer confined between two liquids of different viscosity

Affiliations

Cross-over in the dynamics of polymer confined between two liquids of different viscosity

Giuliana Giunta et al. Interface Focus. .

Abstract

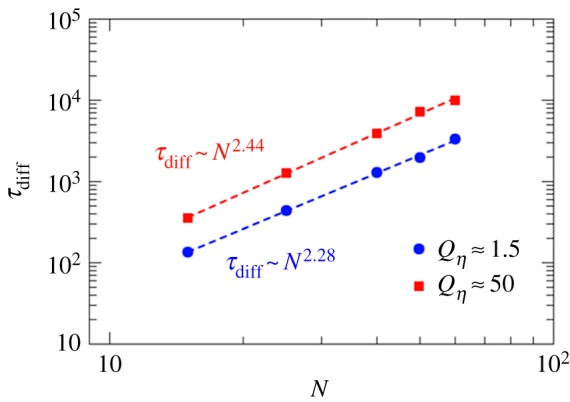
Using molecular dynamics simulations, we analysed the polymer dynamics of chains of different molecular weights entrapped at the interface between two immiscible liquids. We showed that on increasing the viscosity of one of the two liquids the dynamic behaviour of the chain changes from a Zimm-like dynamics typical of dilute polymer solutions to a Rouse-like dynamics where hydrodynamic interactions are screened. We observed that when the polymer is in contact with a high viscosity liquid, the number of solvent molecules close to the polymer beads is reduced and ascribed the screening effect to this reduced number of polymer-solvent contacts. For the longest chain simulated, we calculated the distribution of loop length and compared the results with the theoretical distribution developed for solid/liquid interfaces. We showed that the polymer tends to form loops (although flat against the interface) and that the theory works reasonably well also for liquid/liquid interfaces.

Keywords: Rouse model; Zimm model; free draining; hydrodynamics; polymer dynamics.


Conflict of interest statement

We declare we have no competing interests.

Figures

Figure 1.
Figure 1.
Radius of gyration as a function of the number of monomers in the chain: blue circles, LJ fluids simulation data (Qη ≈ 1.5); red squares, LJ chains simulation data (Qη ≈ 50). (Online version in colour.)
Figure 2.
Figure 2.
Logarithmic plot of the relaxation time, τR (in unit of τ), calculated from the autocorrelation time of the end-to-end distance as a function of (a) the chain length, N, and (b) radius of gyration, Rg. Dashed lines indicate the best fitting for the data. Blue circles, LJ fluids simulation data (Qη ≈ 1.5); red squares, LJ chains simulation data (Qη ≈ 50). (Online version in colour.)
Figure 3.
Figure 3.
Time dependence of mean-square displacement (MSD) of the central monomer, g1, for N = 25 (a) and N = 60 (b). Blue circles represent the data obtained for the system with Qη ≈ 1.5; red squares represent the values of the system with Qη ≈ 50. The dashed lines indicate the different slopes. (Online version in colour.)
Figure 4.
Figure 4.
Central monomer relaxation time of its diffusive motion, τdiff, against the chain length, N. The dashed lines indicate the best fitting of the data. Blue circles, LJ fluids simulation data (Qη ≈ 1.5); red squares, LJ chains simulation data (Qη ≈ 50). (Online version in colour.)
Figure 5.
Figure 5.
(a) Radial distribution function (RDF) calculated between the centre of mass of the polymer and the solvent beads for polymer chain of different length (N) and adsorbed on liquid interface with different viscosity ratio (Qη). N = 25 onto interface with Qη ≈ 1.5 (open green circles), N = 25 onto interface with Qη ≈ 50 (open blue squares), N = 60 onto interface with Qη ≈ 1.5 (filled black circles), N = 60 onto interface with Qη ≈ 50 (filled red squares). Snapshots of a fraction of the polymer chain (green beads) in contact with the fluid monomers within a cut-off radius of 2.5σ for Qη ≈ 1.5 (b) and Qη ≈ 50 (c). The monomer beads F1 are coloured in blue, F2 in orange and C in red (see table 1 for monomer label). (Online version in colour.)
Figure 6.
Figure 6.
Comparison of the self-part of the van Hove correlation function (solid line) and its Gaussian form (dashed line) for polymer chains of different length (N) and adsorbed on liquid interface with different viscosity ratio Qη. (Online version in colour.)
Figure 7.
Figure 7.
(a) Probability distribution (Plp) of loop lengths (s) in unit of monomers. Blue filled and open circles refer to the loops calculated in the system with Qη ≈ 1.5 in the most viscous (MV) and least viscous (LV) phase, respectively; red filled and open squares refer to the loops calculated in the system with Qη ≈ 50 in the MV and LV phase respectively. Dashed line indicates the theoretical prediction by Hoeve [41]. (b) Snapshot of the configuration system with viscosity ratio (Qη ≈ 50): the monomer beads F1 are coloured in blue, C in red and P in grey (see table 1 for monomer label). (Online version in colour.)

References

    1. Fleer G, Stuart MC, Scheutjens JM, Cosgrove T, Vincent B. 1993. Polymers at interfaces. Berlin, Germany: Springer Science & Business Media.
    1. Taddese T, Carbone P. 2017. Effect of chain length on the partition properties of poly(ethylene oxide): comparison between MARTINI coarse-grained and atomistic models. J. Phys. Chem. B 121, 1601–1609. (10.1021/acs.jpcb.6b10858) - DOI - PubMed
    1. Ye S, Tang Q, Yang J, Zhang K, Zhao J. 2016. Interfacial diffusion of a single cyclic polymer chain. Soft Matter 12, 9520–9526. (10.1039/C6SM02103D) - DOI - PubMed
    1. Taddese T, Carbone P, Cheung DL. 2015. Thermodynamics of linear and star polymers at fluid interfaces. Soft Matter 11, 81–93. (10.1039/C4SM02102A) - DOI - PubMed
    1. Cheung DL, Carbone P. 2013. How stable are amphiphilic dendrimers at the liquid-liquid interface? Soft Matter 9, 6841–6850. (10.1039/C2SM27246F) - DOI

LinkOut - more resources