. 2018 Nov 2;9(12):5915-5938.
doi: 10.1364/BOE.9.005915. eCollection 2018 Dec 1.

Multi-wavelength, en-face photoacoustic microscopy and optical coherence tomography imaging for early and selective detection of laser induced retinal vein occlusion

Affiliations

Multi-wavelength, en-face photoacoustic microscopy and optical coherence tomography imaging for early and selective detection of laser induced retinal vein occlusion

Van Phuc Nguyen et al. Biomed Opt Express. .

Abstract

Multi-wavelength en face photoacoustic microscopy (PAM) was integrated with a spectral domain optical coherence tomography (SD-OCT) to evaluate optical properties of retinal vein occlusion (RVO) and retinal neovascularization (RNV) in living rabbits. The multi-wavelength PAM of the RVO and RNV were performed at several wavelengths ranging from 510 to 600 nm. Rose Bengal-induced RVO and RNV were performed and evaluated on eight rabbits using color fundus photography, fluorescein angiography, OCT, and spectroscopic en face PAM. In vivo experiment demonstrates that the spectral variation of photoacoustic response was achieved. The location and the treatment margins of the occluded vasculature as well as the morphology of individual RNV were obtained with high contrast at a laser energy of 80 nJ, which was only half of the American National Standards Institute safety limit. In addition, dynamic changes in the retinal morphology and retinal neovascularization were administered using PA spectroscopy at numerous time points: 0, 3, 7, 14, 21, 28, and 35 days after photocoagulation. The proposed multi-wavelength spectroscopic PAM imaging may provide a potential imaging platform to differentiate occluded retinal vasculature and to improve characterization of microvasculature in a safe and efficient manner.


Conflict of interest statement

The authors declare that there are no conflicts of interest related to this article

Figures

Fig. 1
Fig. 1
Schematic diagram of the integrated en face photoacoustic microscopy (PAM) and optical coherence tomography (OCT) for multimodal ocular imaging.
Fig. 2
Fig. 2
Visualization of retinal blood vessels in rabbits: (a) color fundus photography of the retina. Black arrow denotes the position of arteries, blue arrow reveals the position of the vein, white and yellow arrows represent the location of the optic nerve and choroidal vessels, respectively. White dotted lines display the selected scanning regions for OCT. (b) and (c) early phase and late phase fluorescein angiography of the eye, respectively. (a1-a4) B-scan OCT images of the retinal and choroidal vessels obtained along the selected lines from a. The OCT image showing choroidal vessels (CVs), retinal vessels (RVs), Ganglion cell layer (GCL), nerve fiber layer (NFL) and retinal layers. (d) and (e) 3D volumetric OCT images of retinal and choroidal vessels, respectively.
Fig. 3
Fig. 3
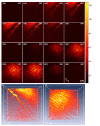
In vivo en face spectroscopic photoacoustic microscopy analysis of the retina and choroid. (a) maximum intensity projection (MIP) PAM images of retinal vessels acquired along the selected scanning area at different wavelengths ranging from 510 to 600 nm. White arrows represent the position of retinal vessels. White dotted arrows illustrate the location of retinal vessels. (b) corresponding en face PAM image of choroidal vessels. The en face PAM image demonstrates individual morphology, high resolution and high contrast of retinal microvasculature. Note that both the retinal and choroidal vessels were visualized and demonstrate higher contrast at the wavelengths of 563, 570 and 580 nm in comparison with shorter and longer wavelengths.
Fig. 4
Fig. 4
Multimodal color fundus photography, FA, and OCT imaging analysis of retinal vein occlusion immediately following RVO to 7 days afterwards. Column A shows color fundus images of the retina performed at different time (15 min after laser treatment, day 1, 3, and 7) after laser-induced RVO. White dotted arrows show the position of treated sites. Dotted lines represent the selected OCT scanning areas. Column B-C display early phase and late phase FA images. White arrows show the location of occluded vessels. Columns A1-A3 exhibit cross-sectional B-scan OCT image acquired along the dotted line in color fundus images (column A). White arrows show the position of retinal detachment after laser treatment. Note that severe retinal detachment appeared at day 1 post treastment and resolved at 3 days after laser exposure. Column D shows 3D rendering of OCT images.
Fig. 5
Fig. 5
Multimodal color fundus photography, FA, and OCT imaging analysis of retinal vein occlusion from day 14 to day 35. White arrows in column B reveal the location of retinal neovascularization. Red arrows (column C) illustrate the leakage areas at late phase FA, confirming the development of retinal neovascularization. Cross-sectional B-scan OCT images (columns A1-A3) exhibit the development of retinal neovascularization around the major retinal vessels (yellow arrows).
Fig. 6
Fig. 6
Spectroscopic photoacoustic microscopy of retinal neovascularization. The en face MIP PAM images of the retina acquired at various wavelength (510-600 nm) at different times after laser treatment: 15 min after treatment (day 0), days 3, 5, 7, 14, 21, 28, and 35. White arrows show the detected position of the retinal vein occlusion as shown on Day 0. Yellow arrows indicate the position of abnormal retinal vessels at day 7 after treatment. White dotted arrows depict the position of retinal neovascularization. The retinal neovascularization developed at day 21 after laser treatment.
Fig. 7
Fig. 7
3D volumetric rendering and image segmentation of the development retinal neovascularization for vessels density estimation: (a-c) 3D visualization of the retinal neovascularization acquired at various wavelengths (532, 570, and 580 nm) at day 28 post laser induced RVO. The 3D volumetric images show clearly morphology of individual microvasculature. (d-f) segmentation images of retinal vessels. Pseudo-colorized red, green, blue and yellow are used to mark the position of retinal artery, RNV, veins, and choroidal vessels, respectively. (g) spectroscopic evaluation on PA amplitudes. (h) vessels density quantification of RNV as a function of treatment time and optical wavelengths. (i) comparison vessel diameter measured from various techniques: fundus photography, OCT and PAM (*p < 0.001 and N = 8).
Fig. 8
Fig. 8
Spectroscopic PAM image of choroidal vessels after laser photocoagulation. (a) color fundus image of choroidal vessels after laser-induced RVO at day 35. The color fundus showing the change in structure and morphology of choroidal vessels. Due to the effect of laser, some of the choroidal vessels are absent as indicating by white arrows. White dotted line and white rectangle exhibit the selected region of interest (ROI). (b) and (c) represent the FA images at early phase and late phase. The white arrows indicate the position of development of neovascularization. (d) cross-sectional b-scan OCT images. White arrows show the location of neovascularization. (e-l) corresponding en face spectroscopic PAM imaging of abnormal choroidal vessels. The PAM images show clearly the structure of individual choroidal vessels. (m) 3D rendering PAM image.
Fig. 9
Fig. 9
Histological analysis of the rabbit retina after laser-induced RVO. (a) and (b) show the H&E-stained images of RVO achieved from control and treatment groups, respectively. Black arrows demonstrate the position of retinal vessels, whereas blue arrows illustrate the appearance of retinal capillaries. The retinal thickness of the treated groups is thinner than that of the one from control group. The RNV development were detected at: (c) × 20 and (d) × 40. Black arrows represent the location of RNV. Blue arrows show the major position of retinal vessels after treatment. (e-g) TUNEL staining assay were carried out to evaluate the potential effect of laser exposure after PAM. Figure 9(e) and Fig. 9(f) are positive and negative control, respectively. Note that brown color indicates the position of apoptotic cells. No significant pathological changes can be observed in the eye tissue (Fig. 9(f)).
Fig. 10
Fig. 10
Sequential fluorescein angiography images. The red arrow shows the position of veins, whereas blue arrow depicts the location of the artery. The time on the top right indicates the number of seconds after intravenous fluorescein dye injection.
Fig. 11
Fig. 11
OCT spectral distribution
Fig. 12
Fig. 12
Color fundus photography. White rectangles indicate the selected scanning areas for PAM
Fig. 13
Fig. 13
Color fundus photography of the retina after laser-induced RVO. White rectangles indicate the selected scanning regions for PAM
Fig. 14
Fig. 14
Fluorescein angiography (FA) images of retinal vein occlusion acquired at various time post-treatment. (a) FA images acquired at day 14, 17, 21 and 28-post laser photocoagulation. The green arrows indicate the position of the developed new retinal neovascularization (RNV). Note that the RNV increased over time and achieved peak at day 28. (b) sequential FA images. The red arrows indicate the region of retinal arteries. The blue arrows show the area of veins. The green and yellow arrows exhibit the areas of RNV and CVs, respectively. The time on the top right indicates the number of seconds after intravenous fluorescein dye injection.

References

    1. Hayreh S. S., “Ocular vascular occlusive disorders: natural history of visual outcome,” Prog. Retin. Eye Res. 41, 1–25 (2014).10.1016/j.preteyeres.2014.04.001 - DOI - PMC - PubMed
    1. Li J., Paulus Y. M., Shuai Y., Fang W., Liu Q., Yuan S., “New developments in the classification, pathogenesis, risk factors, natural history, and treatment of branch retinal vein occlusion,” J. Ophthalmol. 2017, 4936924 (2017).10.1155/2017/4936924 - DOI - PMC - PubMed
    1. Rogers S., McIntosh R. L., Cheung N., Lim L., Wang J. J., Mitchell P., Kowalski J. W., Nguyen H., Wong T. Y., “The Prevalence of Retinal Vein Occlusion: Pooled Data from Population Studies from the United States, Europe, Asia, and Australia,” Ophthalmology 117(2), 313 (2010).10.1016/j.ophtha.2009.07.017 - DOI - PMC - PubMed
    1. Soetikno B. T., Shu X., Liu Q., Liu W., Chen S., Beckmann L., Fawzi A. A., Zhang H. F., “Optical coherence tomography angiography of retinal vascular occlusions produced by imaging-guided laser photocoagulation,” Biomed. Opt. Express 8(8), 3571–3582 (2017).10.1364/BOE.8.003571 - DOI - PMC - PubMed
    1. Coscas F., Glacet-Bernard A., Miere A., Caillaux V., Uzzan J., Lupidi M., Coscas G., Souied E. H., “Optical Coherence Tomography Angiography in Retinal Vein Occlusion: Evaluation of Superficial and Deep Capillary Plexa,” Am. J. Ophthalmol. 161, 160 (2016).10.1016/j.ajo.2015.10.008 - DOI - PubMed

LinkOut - more resources