Characterizing stratum corneum structure, barrier function, and chemical content of human skin with coherent Raman scattering imaging
- PMID: 31065440
- PMCID: PMC6490993
- DOI: 10.1364/BOE.9.006425
Characterizing stratum corneum structure, barrier function, and chemical content of human skin with coherent Raman scattering imaging
Abstract
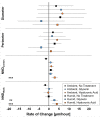
The most superficial layer of the epidermis, the stratum corneum, plays a crucial role in retaining hydration; if its structure or composition is compromised, dry skin may result as a consequence of poor water retention. Dry skin is typically treated with topical application of humectant agents that attract water into the skin. Corneometry, the industry standard for measuring skin hydration, works by assessing the bulk electrical properties of skin. However, this technique samples a large volume of tissue and thus does not resolve the biochemical changes that occur at the cellular level that may underlie mechanisms of dry skin. These limitations can be addressed using coherent Raman scattering (CRS) microscopy to probe the intrinsic vibrational modes of chemical groups such as lipids and water. In the present study, ex vivo human skin explants undergoing dehydration and humectant-induced rehydration were measured via CRS imaging and corneometry. Corneometry data and chemically specific images were obtained from the stratum corneum of each patient sample at each timepoint. The resulting data was statistically analyzed using linear mixed effect model regression analysis. The cellular imaging data revealed water loss in the stratum corneum during dehydration that was correlated with corneometer readings. Interestingly, the imaging data and corneometer readings show differences under the experimental rehydration conditions. The rehydration results suggest that hydration restored by the humectant agents may not be retained by the corneocytes in the ex vivo model system. Given the complementary nature of corneometry, a bulk assessment tool, and CRS microscopy, a modality with subcellular resolution implemented here in an en-face tissue imaging setup, these techniques can be used to measure uptake and efficacy of topical compounds in order to better understand their mode of action and improve therapeutic applications.
Conflict of interest statement
JDC: The Estée Lauder Companies, Inc. (E), CF: The Estée Lauder Companies, Inc. (E), CLE: Massachusetts General Hospital (P,R). All other authors declare that there are no other conflicts of interest related to this article.
Figures


Similar articles
-
Measuring the effects of topical moisturizers on changes in stratum corneum thickness, water gradients and hydration in vivo.Br J Dermatol. 2008 Sep;159(3):567-77. doi: 10.1111/j.1365-2133.2008.08703.x. Epub 2008 Jul 4. Br J Dermatol. 2008. PMID: 18616783 Clinical Trial.
-
Original semiologic standardized evaluation of stratum corneum hydration by Diagnoskin stripping sample.Int J Cosmet Sci. 2004 Jun;26(3):117-27. doi: 10.1111/j.1467-2494.2004.00209.x. Int J Cosmet Sci. 2004. PMID: 18494868
-
Measurement of hydration in the stratum corneum with the MoistureMeter and comparison with the Corneometer.Skin Res Technol. 2004 Feb;10(1):32-7. doi: 10.1111/j.1600-0846.2004.00050.x. Skin Res Technol. 2004. PMID: 14731246
-
Do we alter ultraviolet sensitivity in vivo with stratum corneum rehydration? A pilot study and review of the literature.Br J Dermatol. 2002 Feb;146(2):280-4. doi: 10.1046/j.1365-2133.2002.04585.x. Br J Dermatol. 2002. PMID: 11903240 Review.
-
Structure of the skin barrier and its modulation by vesicular formulations.Prog Lipid Res. 2003 Jan;42(1):1-36. doi: 10.1016/s0163-7827(02)00028-0. Prog Lipid Res. 2003. PMID: 12467638 Review.
Cited by
-
Lipid-Polymeric Films: Composition, Production and Applications in Wound Healing and Skin Repair.Pharmaceutics. 2021 Aug 4;13(8):1199. doi: 10.3390/pharmaceutics13081199. Pharmaceutics. 2021. PMID: 34452160 Free PMC article. Review.
-
A Deep Dive Into the Potential Antiaging Effects of Colla Corii Asini on the Skin: A Comparative Study.J Cosmet Dermatol. 2025 Mar;24(3):e70080. doi: 10.1111/jocd.70080. J Cosmet Dermatol. 2025. PMID: 40012471 Free PMC article.
-
Progress in Multimodal En Face Imaging: feature introduction.Biomed Opt Express. 2019 Apr 1;10(4):2135-2140. doi: 10.1364/BOE.10.002135. eCollection 2019 Apr 1. Biomed Opt Express. 2019. PMID: 31086718 Free PMC article.
-
Translation of two-photon microscopy to the clinic: multimodal multiphoton CARS tomography of in vivo human skin.J Biomed Opt. 2020 Jan;25(1):1-12. doi: 10.1117/1.JBO.25.1.014515. J Biomed Opt. 2020. PMID: 32003191 Free PMC article.
-
Noninvasive Monitoring of Palmitoyl Hexapeptide-12 in Human Skin Layers: Mechanical Interaction with Skin Components and Its Potential Skincare Benefits.ACS Appl Bio Mater. 2025 Mar 17;8(3):2340-2355. doi: 10.1021/acsabm.4c01816. Epub 2025 Feb 18. ACS Appl Bio Mater. 2025. PMID: 39964201 Free PMC article.
References
LinkOut - more resources
Full Text Sources
Other Literature Sources
Research Materials
