. 2018 Nov 28;9(12):6477-6496.
doi: 10.1364/BOE.9.006477. eCollection 2018 Dec 1.

Computational multifocal microscopy

Affiliations

Computational multifocal microscopy

Kuan He et al. Biomed Opt Express. .

Abstract

Despite recent advances, high performance single-shot 3D microscopy remains an elusive task. By introducing designed diffractive optical elements (DOEs), one is capable of converting a microscope into a 3D "kaleidoscope," in which case the snapshot image consists of an array of tiles and each tile focuses on different depths. However, the acquired multifocal microscopic (MFM) image suffers from multiple sources of degradation, which prevents MFM from further applications. We propose a unifying computational framework which simplifies the imaging system and achieves 3D reconstruction via computation. Our optical configuration omits optical elements for correcting chromatic aberrations and redesigns the multifocal grating to enlarge the tracking area. Our proposed setup features only one single grating in addition to a regular microscope. The aberration correction, along with Poisson and background denoising, are incorporated in our deconvolution-based fully-automated algorithm, which requires no empirical parameter-tuning. In experiments, we achieve spatial resolutions of 0.35um (lateral) and 0.5um (axial), which are comparable to the resolution that can be achieved with confocal deconvolution microscopy. We demonstrate a 3D video of moving bacteria recorded at 25 frames per second using our proposed computational multifocal microscopy technique.


Conflict of interest statement

The authors declare that there are no conflicts of interest related to this article.

Figures

Fig. 1
Fig. 1
Single-DOE multifocal microscopy (MFM) setup (a) and computational 3D reconstruction pipeline (d-f). In (a), a conventional microscope is augmented by a 4f system. An MFG (b) is inserted at the Fourier plane of the 4 f system to produce an array of l × l differently focused tile images in a single exposure (c; l = 3). Note that our CMFM system discards CA corrective optics, significantly reducing the system complexity and cost compared to conventional MFM. We correct for CA computationally rather than optically. (d-f) The pipeline of proposed computational framework: by capturing a z-stack 3D PSFs (d), the algorithm can simultaneously recover the background noise b*, the optimal regularizer parameter λ* and a high resolution 3D image (f) from a single captured 2D MFM image (e).
Fig. 2
Fig. 2
A z-stack 3D PSFs of CMFM, measured from a 170nm fluorescent bead. Top row: CMFM lateral PSFs imaged under five different axial positions (columns). each PSF consists of one focused image (outlined by a green box) and eight out-of-focus version images of the bead. xy and xz PSFs (second and third rows) and corresponding OTFs (bottom two rows) of five differently focused tiles (columns). The focal shift property of CMFM can be observed from xz PSFs (third row), verifying that CMFM is capable of capturing a focal stack instantaneously. Although the central tile’s PSF CA-free (first column), the off-axis tiles’ PSFs suffer from directional CA (second to last columns) due to geometry. The lateral spatial frequencies that are lost by CA are shown in xy OTFs (fourth row).
Fig. 3
Fig. 3
CA blur vs defocus blur. An in-focus tile with CA blur (red) and a defocus blur (blue) are highlighted in (a), whose PSFs and OTFs are shown in (b). (c) plots a comparison of linecuts indicated by blue and magenta lines in (b). For reference, a linecut in CA-free central tile’s OTF (shown in first column and fourth row of Fig. 2) is also plotted (red). A reconstruction comparison is shown in the right panel. (d) Object image. (e) Observation image (for visualization purpose, each tile image is cropped). (f) Reconstruction using only in-focus PSF. (g) Reconstruction using all the PSFs.
Fig. 4
Fig. 4
(a) Conventional MFM design uses a large tile spacing. (b) We propose to use a smaller tile spacing, so as to achieve a small lateral FOV that can be tracked over a large area for MFM tracking applications.
Fig. 5
Fig. 5
Simulations showing the capability of the proposed MFM of achieving larger lateral tracking space than conventional MFM does. (a) The synthetic 3D ground truth of an ellipsoid (left) and its xz slice (right). The center of the ellipsoid is 35.8um away from the center of the detector in x direction. MFM measurements (e-f) and corresponding reconstructions (b-c) by different design methods. (d) 1D axial profile comparison between ground truth (red) and reconstructions (black and blue). It is clear that the ellipsoid is reconstructed poorly from conventional MFM method while our design provides a good reconstruction. Signal loss as a function of lateral position of the tracked object for conventional (g) and our designed MFM (h). Similar to vignetting effect, the signal falls off when approaching the edges. Our proposed design alleviates peripheral signal loss and achieves an enlarged lateral tracking area.
Fig. 6
Fig. 6
Two experimental snapshot MFM raw images. (a) Experiment 1: snapshot captured 2D MFM image of multiple static periplasms by using an MFG with 9 focal planes under exposure time of 0.5s. (b) Experiment 2: a frame from an MFM video of a moving bacterium captured at 25 fps by using an MFG with 25 focal planes. The raw MFM video is shown in Visualization 1.
Fig. 7
Fig. 7
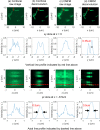
Proposed computational 3D reconstruction of CMFM image in comparison with confocal deconvolution results. (a) Confocal raw data and (b) its deconvolution results. (c) CMFM raw data and (d) its computational reconstruction results. In (a), confocal scan is taken with a dual spinning disk confocal microscope (Model: CSU-W1) with the total acquisition time of 20s, while in (c), the CMFM raw data is captured in a single exposure of 0.5s. The lateral resolution of the proposed computational reconstruction is about 0.35um (second row of d) and the axial resolution is about 0.5um (fourth row of d), which are comparable with those achievable with confocal deconvolution microscopy (second and fourth rows of b).
Fig. 8
Fig. 8
Experimental 3D reconstructions of a movable bacterium. A raw MFM video (shown in Visualization 1) was captured at 25fps as the bacterial moves in 3D space. The computational 3D reconstruction was performed for each video frame. Five out of sixty frames reconstruction is shown in (a-e). (f) 3D trajectory of the bacterium by computing and tracking its center of mass for each frame reconstruction. The colorbar indicate the frame index over time. The complete 3D video reconstruction from the first frame to the last frame is shown in Visualization 2.
Fig. 9
Fig. 9
Simulations that demonstrate the capability of the joint RL-TV algorithm to simultaneously recover the 3D image, background noise and the optimal regularizer parameter for CMFM. Top left: a ground truth image. Top right: the standard RL deconvolution without TV regularizer (λ = 0). Bottom left: RL-TV deconvolution by using an incorrect background values (b = 10). Bottom right: joint RL-TV deconvolution can simultaneously recover a 3D image, background noise and the optimal regularizer parameter. The PSNRs for three methods are 34.2dB, 27.5dB, 40.2dB, and I-divergences are 204.3, 517, and 96.7, respectively.
Fig. 10
Fig. 10
The convergence analysis of the joint RL-TV algorithm for the simulated CMFM. (a) The reconstructed background noise value and (b) optimal regularizer parameter during the iteration of joint RL-TV deconvolution process. (c) PSNR and (d) I-divergence between the ground truth image and reconstructed image at each iteration of the deconvolution process.
Fig. 11
Fig. 11
The recovered background values (left) and optimal regularizer parameter λ (right) at each iteration of the joint RL-TV deconvolution process for the first experiment.
Fig. 12
Fig. 12
The recovered background values (left) and optimal regularizer parameter λ (right) for each video frame of a movable bacterium.

References

    1. Blanchard P. M., Greenaway A. H., “Simultaneous multiplane imaging with a distorted diffraction grating,” Appl. Opt. 38, 6692–6699 (1999).10.1364/AO.38.006692 - DOI - PubMed
    1. Abrahamsson S., Ilic R., Wisniewski J., Mehl B., Yu L., Chen L., Davanco M., Oudjedi L., Fiche J.-B., Hajj B., Jin X., Pulupa J., Cho C., Mir M., Beheiry M. E., Darzacq X., Nollmann M., Dahan M., Wu C., Lionnet T., Liddle J. A., Bargmann C. I., “Multifocus microscopy with precise color multi-phase diffractive optics applied in functional neuronal imaging,” Biomed. Opt. Express 7, 855–869 (2016).10.1364/BOE.7.000855 - DOI - PMC - PubMed
    1. Oudjedi L., Fiche J.-B., Abrahamsson S., Mazenq L., Lecestre A., Calmon P.-F., Cerf A., Nöllmann M., “Astigmatic multifocus microscopy enables deep 3d super-resolved imaging,” Biomed. Opt. Express 7, 2163–2173 (2016).10.1364/BOE.7.002163 - DOI - PMC - PubMed
    1. Abrahamsson S., Chen B. H. J., Stallinga S., Katsov A. Y., Wisniewski J., Mizuguchi G., Soule P., Mueller F., Darzacq C. D., Darzacq X., Wu C., Bargmann C. I., Agard D. A., Dahan M., Gustafsson M. G. L., “Fast multicolor 3d imaging using aberration-corrected multifocus microscopy,” Nat. methods 10, 60–63 (2013).10.1038/nmeth.2277 - DOI - PMC - PubMed
    1. Prevedel R., Yoon Y.-G., Hoffmann M., Pak N., Wetzstein G., Kato S., Schrödel T., Raskar R., Zimmer M., Boyden E. S., Vaziri A., “Simultaneous whole-animal 3d imaging of neuronal activity using light-field microscopy,” Nat. methods 11, 727–730 (2014).10.1038/nmeth.2964 - DOI - PMC - PubMed

LinkOut - more resources