. 2019 Mar 14;6(9):1801780.
doi: 10.1002/advs.201801780. eCollection 2019 May 3.

Collagen Fibrils Mechanically Contribute to Tissue Contraction in an In Vitro Wound Healing Scenario

Affiliations

Collagen Fibrils Mechanically Contribute to Tissue Contraction in an In Vitro Wound Healing Scenario

Erik Brauer et al. Adv Sci (Weinh). .

Abstract

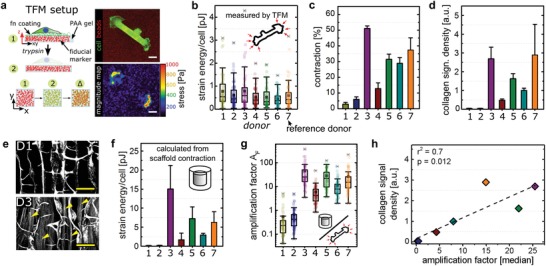
Wound contraction is an ancient survival mechanism of vertebrates that results from tensile forces supporting wound closure. So far, tissue tension was attributed to cellular forces produced by tissue-resident (myo-)fibroblasts alone. However, difficulties in explaining pathological deviations from a successful healing path motivate the exploration of additional modulatory factors. Here, it is shown in a biomaterial-based in vitro wound healing model that the storage of tensile forces in the extracellular matrix has a significant, so-far neglected contribution to macroscopic tissue tension. In situ monitoring of tissue forces together with second harmonic imaging reveal that the appearance of collagen fibrils correlates with tissue contraction, indicating a mechanical contribution of tensioned collagen fibrils in the contraction process. As the re-establishment of tissue tension is key to successful wound healing, the findings are expected to advance the understanding of tissue healing but also underlying principles of misregulation and impaired functionality in scars and tissue contractures.

Keywords: cell force; collagen; extracellular matrix; second harmonic imaging; tension; tissue regeneration; traction force microscopy; wound contraction.


Conflict of interest statement

The authors declare no conflict of interest.

Figures

Figure 1
Figure 1
A structured collagen scaffold directs cell organization and ECM formation. a) Visualization of the highly organized cylindrical shaped scaffold (5 mm Ø) (top left). Pictographic representation indicating radial (red) and axial (blue) direction of view (bottom left). Center and right panels show SEM images of pore architecture in radial (red dot) and axial direction (blue dot) including structural analysis of pore diameter (lower left) and wall thickness (lower right). Scale bar 250 µm. b) Compressive stiffness E of collagen scaffolds measured perpendicular (radial) or in the direction (axial) of the pores (mean ± S.D., n = 4). c) Compressive stiffness plotted over compression cycles (n = 4). Black lines indicate the mean with blue/red belt as standard deviation. d) Confocal images of collagen scaffolds imaged in axial direction after 3, 7, or 14 d of culture. Samples were stained for fibronectin (green), actin (red), or cell nuclei (blue). Fibrillar collagen was visualized by SHI (lower panel). Yellow arrows indicate little influence of struts on structural alignment of collagen fibrils at later stages of culture. Scale bar 100 µm. e) Circular plots indicating the orientation distribution of actin (red), fibronectin (green), and collagen fibrils (grey) after 3,7, or 14 d of culture relative to the local pore orientation. The means are reflected as dark lines with standard deviation as colored belt (n = 2–4). f) Quantification of collagen signal density (a.u., arbitrary units) inside scaffold pores (mean ± S.D., n = 4–9). g) Quantification of the local anisotropy of fibrillar collagen signal inside scaffold pores (mean ± S.D., n = 4). Significance levels were calculated using the Mann–Whitney U test (two‐sided) with the Bonferroni correction for comparison of multiple groups. Significance levels indicate # p < 0.1, * p < 0.05.
Figure 2
Figure 2
Macroscopic contraction depends on the deposition of a fibrillar collagen ECM. a) SHI of microtissues after 14 d of culture including ascorbic acid supplementation. Yellow arrowheads indicate cell‐produced collagen fibrils. Scale bar 100 µm. b) Representative scans of seeded scaffolds for axial (blue dots) and radial (red dots) directions after seeding (day 0) and day 14 of culture with ascorbic acid supplementation. Scale bar 2 mm. c) Quantification of scaffold contraction in axial and radial directions expressed as percent of initial volume (day 0) for 3, 7, and 14 d of culture with ascorbic acid supplementation (n = 13–24). d) Calculated strain energy levels of the collagen scaffold as a result of macroscopic contraction both for radial (red) and axial (blue) direction (n = 7–19). e) SHI of microtissues after 14 d of culture without ascorbic acid supplementation. Scale bar 100 µm. f) Representative scans of seeded scaffolds for axial (red dots) and radial (blue dots) directions after seeding (day 0) and day 14 of culture without ascorbic acid supplementation. Scale bar 2 mm. g) Quantification of scaffold contraction in axial and radial directions expressed as percent of initial volume (day 0) for 3, 7, and 14 d of culture without ascorbic acid supplementation (n = 8). h) Calculated strain energy levels (total sample) as a result of macroscopic contraction cultured either in the presence or absence of ascorbic acid (n = 8–14). Significance levels via the Mann–Whitney U test (two‐sided) and significance levels are indicated by symbols: * p < 0.05, ** p < 0.01, *** p < 0.001.
Figure 3
Figure 3
Fibrillar collagen amplifies single cell traction forces. a) Pictographic representation of TFM procedure based on the displacement of fiducial markers. Right: original image with fluorescent beads of 100 nm size (red) and cell (green) and calculated force magnitude map. Scale bar 20 µm. b) Single cell strain energies of at least 60 cells from three independent experiments measured by TFM for seven primary donors. Each colored dot represents the calculated value of a single cells. c) Quantification of scaffold contraction (total volume) of seven primary donors cultured with ascorbic acid after two weeks of culture (mean ± S.D., n = 3–9). d) Quantification of fibrillar collagen signal density of scaffolds seeded with seven different primary donors after two weeks of culture (mean ± S.D., n = 3–7). e) SHI of scaffolds seeded with hdFs derived from donors 1 or 3 and cultivated for 14 d in the presence of ascorbic acid. Yellow arrowheads indicate cell‐secreted collagen fibrils. Scale bar 100 µm. f) Calculated strain energy levels of total samples as a result of macroscopic contraction which were normalized to the total cell number. This results in values of strain energy per cell related to macroscopic contraction (mean ± S.D., n = 3–9). g) Calculated amplification factor for at least 60 cells reflecting the ratio between macroscopic strain energy per cell and the single cell force. h) Correlation of fibrillar collagen density and the median of calculated amplification factors indicating a positive linear correlation (r 2 = 0.7).
Figure 4
Figure 4
Scaffold stiffness determines cellular strain output. a) Compressive stiffness of human fracture hematoma measured by monoaxial compression testing. Each colored dot represents the stiffness of 1 donor sample (10 in total). b) Histological sections of human fracture hematoma analyzed by Sirius red staining and SHI for visualization of collagen fibrils. Scale bar 200 µm in close‐up views (1–4). c) Compressive stiffness of three different scaffolds (mean ± S.D., n = 3 each) produced from a collagen suspension of varying solid content (1.1–3.0 wt%). The compressive stiffness was measured both in axial (compression along the pores, blue) and radial (compression perpendicular to the pores, red) directions of the structured scaffolds. d) Quantification of scaffold axial contraction for hdFs cultured over 2 weeks inside the three prototypes (mean ± S.D., n = 3–9) either with or without the supplementation of ascorbic acid. Contraction is plotted over compressive stiffness (axial) of the scaffold prototypes A, B, and C. e) Quantification of fibrillar collagen density after culture of hdFs inside scaffold prototypes (mean ± S.D., n = 3–9) for 2 weeks either with or without the supplementation of ascorbic acid. Fibrillar collagen density is plotted over axial stiffness of the scaffold prototypes A, B, and C. Statistics via the Mann–Whitney U test (two‐sided). Significance levels are indicated as: # p < 0.1., ** p < 0.01.
Figure 5
Figure 5
Fibrillar collagen stores cell‐generated traction forces. a) Confocal images of hdFs seeded into scaffolds and cultured for 14 d either before (native) or after (decellularized) decellularization. Samples were stained for fibronectin (green), actin (red), and nuclei (blue). Scale bar 100 µm. b) Quantification of fibrillar collagen density inside scaffold pores after 3,7, or 14 d of culture before and after decellularization (mean ± S.D., n = 4–9). c) Functional enrichment analysis of detected proteins that were identified by mass spectrometry (GO:0005581, collagen trimer, red spheres). Lines illustrate interactions based on experiments, databases, coexpression, and co‐occurrence in which the thickness depends on strength of data support. Minimum required interaction score: 0.7. d) EmPAI (exponentially modified protein abundance index) presented as heat map for three independent samples. e) Quantification of contraction after decellularization both for radial (red) and axial (blue) view (mean ± S.D., n = 3–18). f) Calculated strain energies derived from scaffold contraction both for radial and axial view (mean ± S.D., n = 3–18). Statistics via the Mann–Whitney U test (two‐sided). Significance levels are indicated as: * p < 0.05., ** p < 0.01, ***p < 0.001.
Figure 6
Figure 6
Fibrillar collagen amplifies single cell forces. Graphical illustration of the here described tissue formation and tensioning process. Following initial cellular spreading and adhesion (1), cells incrementally deposit tensioned collagen fibrils (black arrows, 2) which leads to a gradual increase in the total force resulting in a macroscopic contraction (3). By this, the amount of macroscopic force exceeds the sum of single cell forces or contributions from nonfibrillar ECM networks. The collagen deposition rate thus determines the quantity of macroscopic contraction and tensioning of regenerating tissues, which is important to restore their function. Increased contraction, however, is associated with pathologies such as fibrosis and cancer.

References

    1. Rudolph R., World J. Surg. 1980, 4, 279. - PubMed
    1. Berry D. P., Harding K. G., Stanton M. R., Jasani B., Ehrlich H. P., Plast. Reconstr. Surg. 1998, 102, 124. - PubMed
    1. Tomasek J. J., Gabbiani G., Hinz B., Chaponnier C., Brown R. R., Nat. Rev. Mol. Cell Biol. 2002, 3, 349. - PubMed
    1. Hinz B., J. Biomech. 2010, 43, 146. - PubMed
    1. Rozario T., DeSimone D. W., Dev. Biol. 2010, 341, 126. - PMC - PubMed

LinkOut - more resources