

Twenty-four hour pharmacokinetic relationships for intravenous vancomycin and novel urinary biomarkers of acute kidney injury in a rat model
- PMID: 31065686
- PMCID: PMC6640290
- DOI: 10.1093/jac/dkz167
Twenty-four hour pharmacokinetic relationships for intravenous vancomycin and novel urinary biomarkers of acute kidney injury in a rat model
Abstract
Objectives: To identify the pharmacokinetic (PK) and toxicodynamic (TD) relationship for vancomycin-induced kidney injury.
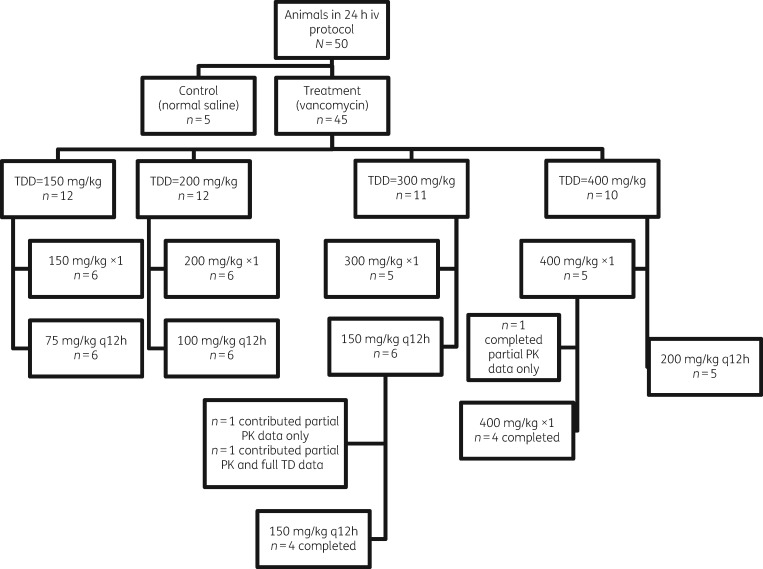
Methods: Male Sprague-Dawley rats received intravenous (iv) vancomycin. Doses ranging from 150 mg/kg/day to 400 mg/kg/day were administered as a single or twice-daily injection over 24 h (total protocol duration). Controls received iv saline. Plasma was sampled with up to eight samples in 24 h per rat. Twenty-four hour urine was collected and assayed for kidney injury molecule 1 (KIM-1), osteopontin and clusterin. Vancomycin in plasma was quantified via LC-MS/MS. PK analyses were conducted using Pmetrics for R. PK exposures during the first 24 h (i.e. AUC0-24h, Cmax 0-24h and Cmin 0-24h) were calculated. PK/TD relationships were assessed with Spearman's rank coefficient (rs) and the best-fit mathematical model.
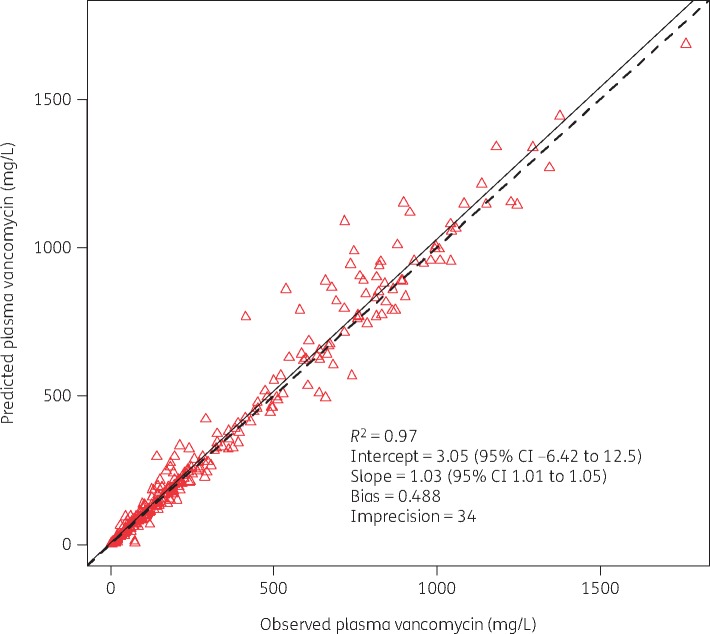
Results: PK/TD data were generated from 45 vancomycin-treated and 5 control rats. A two-compartment model fit the data well (Bayesian: observed versus predicted R2 = 0.97). Exposure-response relationships were found between AUC0-24h versus KIM-1 and osteopontin (R2 = 0.61 and 0.66) and Cmax 0-24h versus KIM-1 and osteopontin (R2 = 0.50 and 0.56) using a four-parameter Hill fit. Conversely, Cmin 0-24h was less predictive of KIM-1 and osteopontin (R2 = 0.46 and 0.53). A vancomycin AUC0-24h of 482.2 corresponded to a 90% of maximal rise in KIM-1.
Conclusions: Vancomycin-induced kidney injury as defined by urinary biomarkers is driven by vancomycin AUC or Cmax rather than Cmin. Further, an identified PK/TD target AUC0-24h of 482.2 mg·h/L may have direct relevance to human outcomes.
© The Author(s) 2019. Published by Oxford University Press on behalf of the British Society for Antimicrobial Chemotherapy. All rights reserved. For permissions, please email: journals.permissions@oup.com.
Figures

References
-
- Pakyz AL, MacDougall C, Oinonen M. et al. Trends in antibacterial use in US academic health centers: 2002 to 2006. Arch Intern Med 2008; 168: 2254–60. - PubMed
-
- Polk RE, Hohmann SF, Medvedev S. et al. Benchmarking risk-adjusted adult antibacterial drug use in 70 US academic medical center hospitals. Clin Infect Dis 2011; 53: 1100–10. - PubMed
-
- Weiss AJ, Elixhauser A.. Overview of Hospital Stays in the United States, 2012: Statistical Brief #180 Healthcare Cost and Utilization Project (HCUP) Statistical Briefs Rockville, MD, USA, 2006. https://www.hcup-us.ahrq.gov/reports/statbriefs/sb180-Hospitalizations-U....
Publication types
MeSH terms
Substances
Grants and funding
LinkOut - more resources
Full Text Sources
Medical
Research Materials
