. 2019 Jul 9;47(12):6160-6171.
doi: 10.1093/nar/gkz344.

c-MYC empowers transcription and productive splicing of the oncogenic splicing factor Sam68 in cancer

Affiliations

c-MYC empowers transcription and productive splicing of the oncogenic splicing factor Sam68 in cancer

Cinzia Caggiano et al. Nucleic Acids Res. .

Abstract

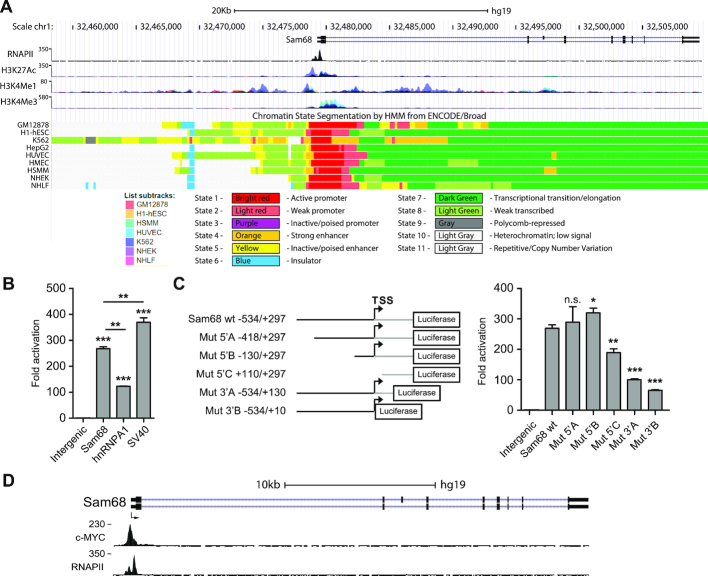
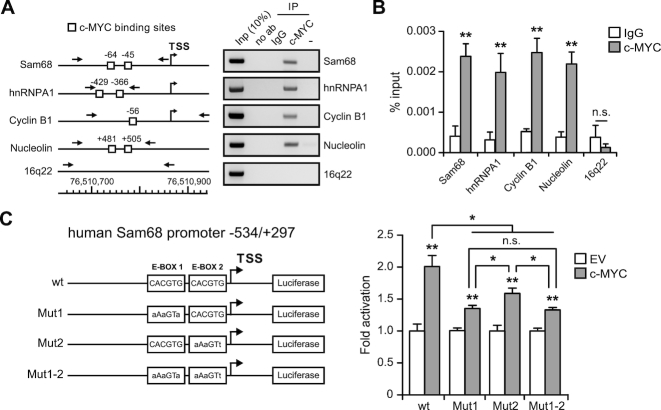
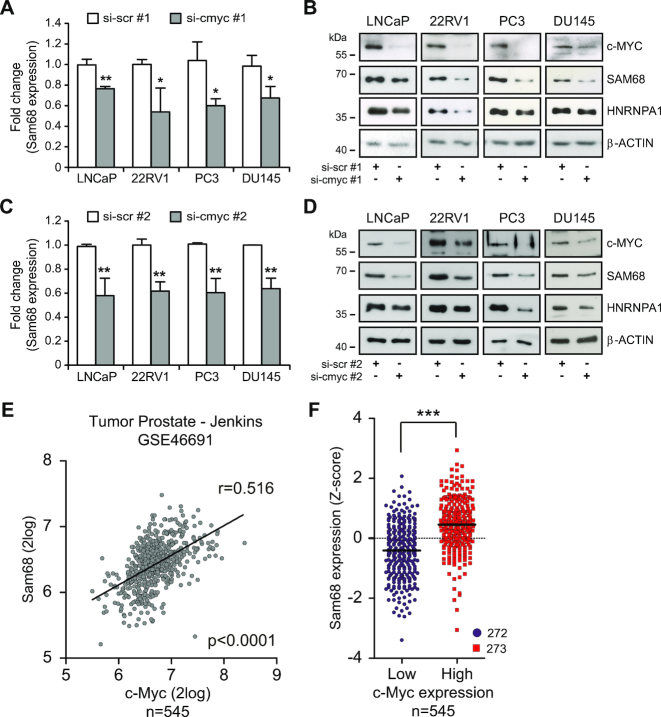
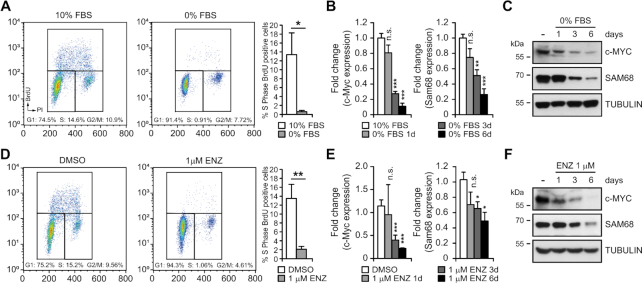
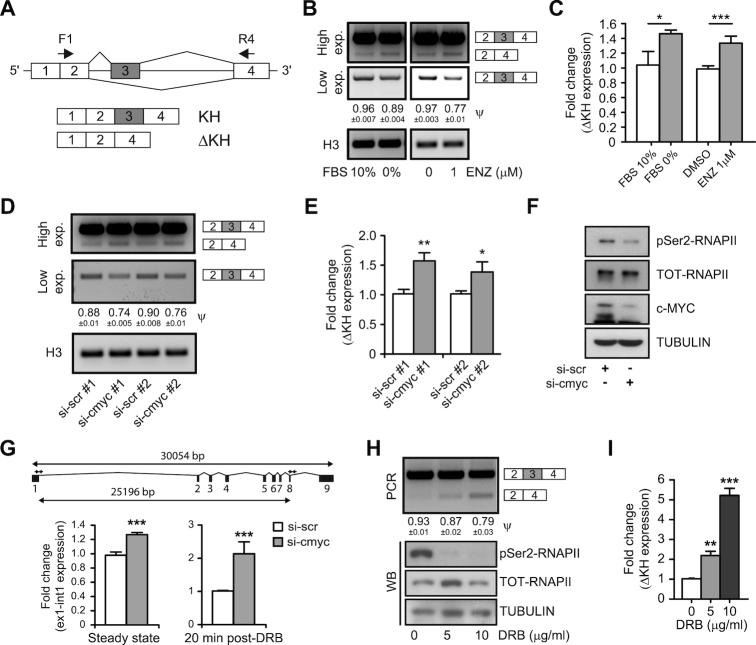
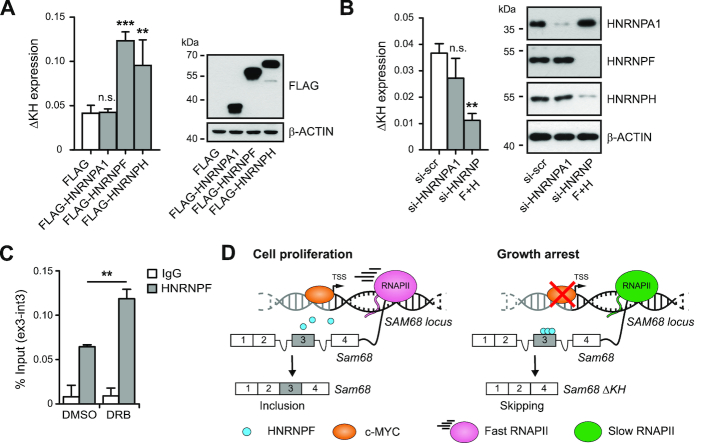
The splicing factor Sam68 is upregulated in many human cancers, including prostate cancer (PCa) where it promotes cell proliferation and survival. Nevertheless, in spite of its frequent upregulation in cancer, the mechanism(s) underlying its expression are largely unknown. Herein, bioinformatics analyses identified the promoter region of the Sam68 gene (KHDRBS1) and the proto-oncogenic transcription factor c-MYC as a key regulator of Sam68 expression. Upregulation of Sam68 and c-MYC correlate in PCa patients. c-MYC directly binds to and activates the Sam68 promoter. Furthermore, c-MYC affects productive splicing of the nascent Sam68 transcript by modulating the transcriptional elongation rate within the gene. Importantly, c-MYC-dependent expression of Sam68 is under the tight control of external cues, such as androgens and/or mitogens. These findings uncover an unexpected coordination of transcription and splicing of Sam68 by c-MYC, which may represent a key step in PCa tumorigenesis.


Figures

Figure 1.
Figure 1.
Identification of the Sam68 promoter region. (A) UCSC Genome Browser snapshot of RNAPII, H3K27Ac, H3K4Me1 and H3K4Me3 ChIP-seq profiles and Chromatin State Segmentation of the Sam68 locus, including an ∼20 Kbp upstream intergenic region. Chromatin state segmentation (colored rectangles; state 1–11) and cell lines (colored squares; List subtracks) are indicated. (B and C) Bar graphs represent luciferase activity of Sam68, hnRNP A1 and SV40 promoters compared to an upstream intergenic region (intergenic; −17753 to −16920 bp from the TSS) used as negative control (B), and of Sam68 promoter deletion mutants (Mut5′A, Mut5′B, Mut5′C, Mut3′A, Mut3′B) compared to the wild-type (wt) and interegenic reporters (C). A schematic representation of wt and mutant reporters is also shown; the upstream (black line) and downstream (gray line) regions from the Sam68 TSS are indicated (C; left panel). All Luciferase assays were performed in HEK293T 48 h post-transfection. Data represent mean ± SD of three biological replicates. Statistical significance was calculated by Student's t-test. *P < 0.05; **P < 0.01; ***P < 0.001; n.s., not significant. (D) Representative ChIP-seq analysis of c-MYC and RNAPII binding to the Sam68 promoter region in NB4 cells with a schematic representation of the Sam68 gene structure showing predicted TSS (arrow), introns (horizontal lines) and exons (boxes).
Figure 2.
Figure 2.
c-Myc binds to the Sam68 promoter region. (A) sqPCR and (B) qPCR analyses of ChIP experiments performed in LNCaP cells using c-MYC antibody and IgG (IgG), or no antibody (no ab), as negative control. Associated DNA is expressed as % of input (B). Schematic representation of the indicated gene promoters and of the 16q22 intergenic region is shown in (A) (left panel). c-MYC binding sites (solid box), TSS and primers position for PCR analyses (arrows) are indicated. (C) The bar graph represents the luciferase assay performed in HEK293T cells transfected with wt or mutated (Mut1, Mut2 and Mut1-2) Sam68 promoter reporters in combination, or not (empty vector, EV), with c-MYC-pCDNA3 vector (c-MYC). A schematic representation of wt and c-MYC binding site mutants (Mut1, Mut2 and Mut1-2) of the Sam68 promoter is also shown (left panel). (B and C) Data represent mean ± SD of three biological replicates. *P < 0.05; **P < 0.01; ***P < 0.001; n.s., not significant (Student's t-test).
Figure 3.
Figure 3.
c-MYC regulates Sam68 expression in PCa. (AD) qPCR (A and C) and western blot (B and D) analyses of Sam68 expression in PCa cells lines transfected with two different pools of c-Myc (si-cmyc #1 and si-cmyc #2) or control (si-scr #1 and si-scr #2) siRNAs. (A and C) Fold change of Sam68 expression relative to Histone 3 expression was calculated by the ΔΔCq method. Data represent mean ± SD of three biological replicates. *P < 0.05; **P < 0.01 (Student's t-test). (E) Plot showing Sam68 and c-MYC expression in 545 PCa patients retrieved from the Jenkins (GSE46691) dataset. Pearson’s correlation coefficient (r) and P-value are reported. (F) Sam68 expression profile in PCa patients (Jenkins-GSE46691) classified according to Z-score normalization in c-MYClow (blue circles) and c-MYChigh (red squares) expressing group. The dot plot shows distribution and the median (horizontal line). Statistical significance was calculated by Mann–Whitney test, *** P < 0.001.
Figure 4.
Figure 4.
PCa cell growth arrest concomitantly induces c-MYC and Sam68 downregulation. (AF) Representative dot plot profiles of cytometric analyses showing DNA content versus BrdU incorporation in LNCaP cells after 6 days of serum deprivation (A) or 1 μM Enzalutamide (D) conditions. Bar graphs (A and D) represents the percentage of S-phase BrdU positive cells after 6 days of treatment. qPCR (B and E) and western blot (C and F) time-course analyses of c-MYC and Sam68 expression (1d: 1 day; 3d: 3 days; 6d: 6 days). Fold change of Sam68 and c-MYC expression relative to Histone 3 expression was calculated by the ΔΔCq method. Data represent mean ± SD of three biological replicates. *P < 0.05; **P < 0.01; ***P < 0.001; n.s., not significant (Student's t-test).
Figure 5.
Figure 5.
c-MYC modulates the AS of Sam68. (A) Diagram showing AS of Sam68. Exons (boxes), introns (horizontal lines) and position (arrows) of primers used for sqPCR are shown. (BE) sqPCR (B and D) and qPCR (C and E) analyses of Sam68-ΔKH and KH splicing in LNCaP cells cultured under serum deprivation condition (0% FBS) or in presence of 1 μM Enzalutamide (Enz) (B and C), or transfected with control (si-scr #1 and #2) or c-MYC (si-myc #1 and #2) siRNAs (D and E). (F) Representative western blot analysis showing the expression level of c-MYC, total (TOT-RNAPII) and Serine2 (pSer2-RNAPII) RNAPII in LNCaP cells transfected with control (si-scr #1) or c-MYC (si-myc #1) siRNAs. Tubulin was used as loading control. (G) Bar graphs represent qPCR evaluation of Sam68 exon1-intron1 and exon8–intron8 ratio performed at steady state level (left) and 20min post-DRB release (right). LNCaP cells transfected with either control (si-scr #1) or c-MYC (si-cmyc #1) siRNAs were treated with 75 μM DRB for 6 h and RNA was extracted 20 min after DRB release. Data are reported as fold change of Sam68 exon1–intron1 relative to exon8–intron8 expression calculated by the ΔΔCq method. A scheme of Sam68 gene and primers position (arrows) used for qPCR is shown. (H and I) sqPCR (H) and qPCR (I) analyses showing Sam68-ΔKH and -KH ratio in LNCaP cells treated for 12 h with suboptimal DRB concentration. A representative western blot (WB) analysis (H) of the pSer2-RNAPII and TOT-RNAPII expression levels is also shown. Tubulin was used as loading control. (B, D and H) The Percent of Spliced-In Index (PSI; ψ) is reported below the gels. (C, E and I) Fold change of Sam68-ΔKH expression relative to Sam68-KH expression was calculated by the ΔΔCq method. (B–E, G–I) Mean ± SD of three biological replicates. *P < 0.05; **P < 0.01; ***P < 0.001 (Student's t-test).
Figure 6.
Figure 6.
hnRNP F modulates the AS of Sam68 exon 3. (A and B) qPCR analyses of in vivo splicing assay performed in LNCaP cells transfected (A) or depleted (B) for the indicated splicing factors. Bar graphs (A and B; left panels) show the fold change of Sam68-ΔKH expression relative to Sam68-KH expression calculated by the ΔΔCq method. A representative western blot analysis (A and B; right panel) to asses the expression levels of the indicated splicing factors is shown. β-actin was used as loading control. (C) CLIP assays performed in LNCaP cells treated (DRB) or not (DMSO) with 5 μg/ml of DRB to detect the recruitment of hnRNP F on the endogenous Sam68 pre-mRNA. The immunoprecipitation was performed using hnRNP F antibody or IgGs, as negative control. RNA associated with hnRNP F was quantified by qPCR using primers located at the Sam68 exon 3–intron 3 boundary and represented as percentage (%) of input. (D) Schematic model for c-MYC-driven Sam68 gene expression and AS regulation. (AC) Bars represent mean ± SD of three biological replicates. **P < 0.01; ***P < 0.001; n.s., not significant (Student's t-test).

References

    1. Siegel R.L., Miller K.D., Jemal A.. Cancer Statistics, 2017. CA Cancer J. Clin. 2017; 67:7–30. - PubMed
    1. Pignot G., Maillet D., Gross E., Barthelemy P., Beauval J.B., Constans-Schlurmann F., Loriot Y., Ploussard G., Sargos P., Timsit M.O. et al. .. Systemic treatments for high-risk localized prostate cancer. Nat. Rev. Urol. 2018; 15:498–510. - PubMed
    1. Munkley J., Livermore K., Rajan P., Elliott D.J.. RNA splicing and splicing regulator changes in prostate cancer pathology. Hum. Genet. 2017; 136:1143–1154. - PMC - PubMed
    1. Sette C. Alternative splicing programs in prostate cancer. Int. J. Cell Biol. 2013; 2013:458727–458737. - PMC - PubMed
    1. Hu R., Lu C., Mostaghel E.A., Yegnasubramanian S., Gurel M., Tannahill C., Edwards J., Isaacs W.B., Nelson P.S., Bluemn E. et al. .. Distinct transcriptional programs mediated by the ligand-dependent full-length androgen receptor and its splice variants in castration-resistant prostate cancer. Cancer Res. 2012; 72:3457–3462. - PMC - PubMed

Publication types

MeSH terms

Substances