. 2019 May 8:8:e44890.
doi: 10.7554/eLife.44890.

The relationship between spatial configuration and functional connectivity of brain regions revisited

Affiliations

The relationship between spatial configuration and functional connectivity of brain regions revisited

Janine Diane Bijsterbosch et al. Elife. .

Abstract

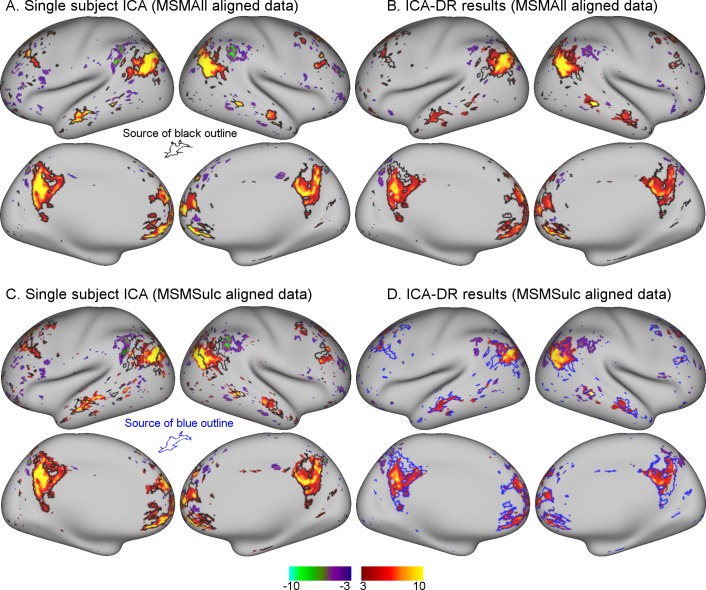
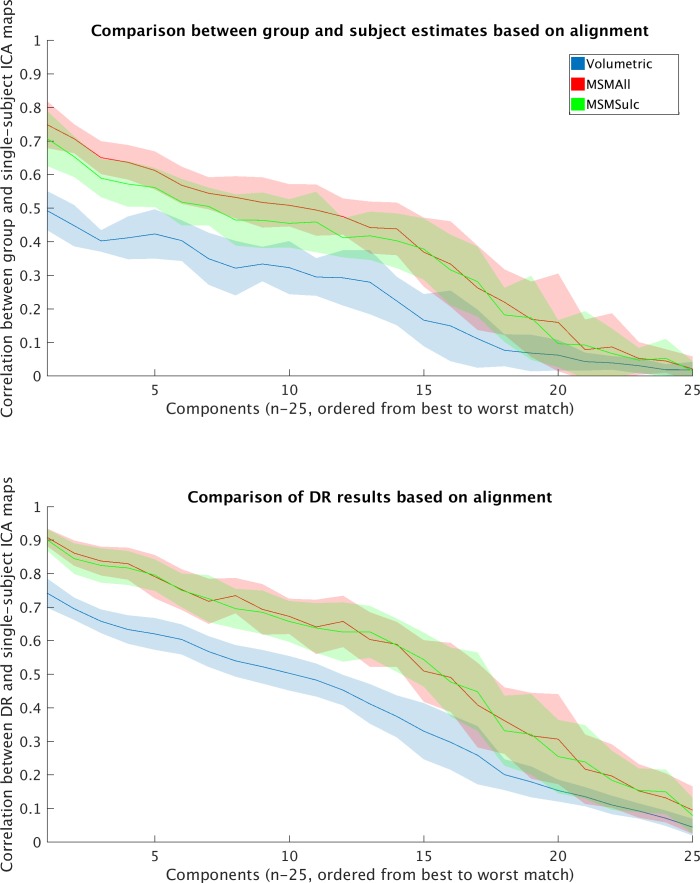
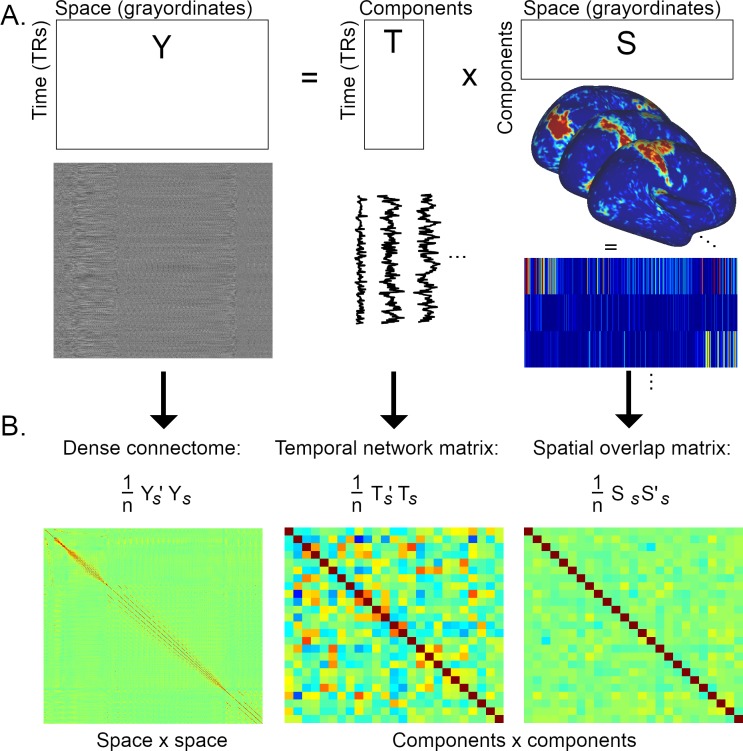
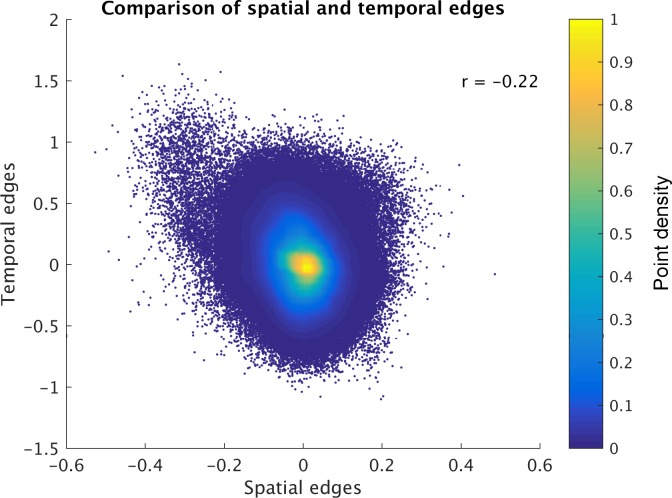
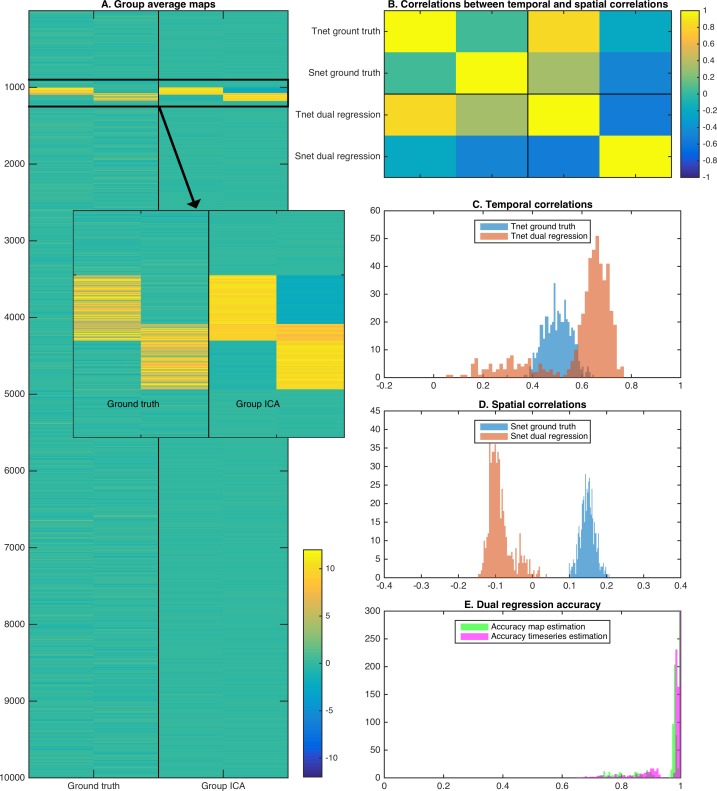
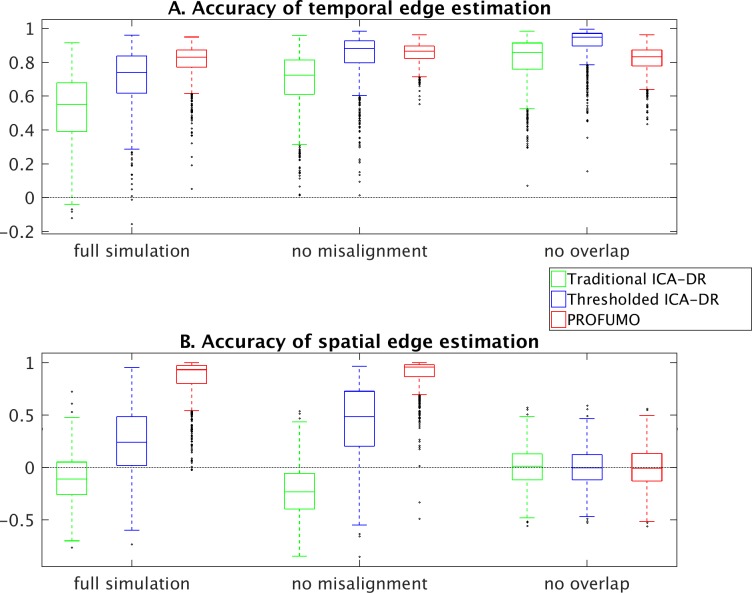
Previously we showed that network-based modelling of brain connectivity interacts strongly with the shape and exact location of brain regions, such that cross-subject variations in the spatial configuration of functional brain regions are being interpreted as changes in functional connectivity (Bijsterbosch et al., 2018). Here we show that these spatial effects on connectivity estimates actually occur as a result of spatial overlap between brain networks. This is shown to systematically bias connectivity estimates obtained from group spatial ICA followed by dual regression. We introduce an extended method that addresses the bias and achieves more accurate connectivity estimates.

Keywords: dual regression; functional connectivity; functional connectomes; human; neuroscience; parcellation; resting state.


Conflict of interest statement

JB, CB, MW, SS, SH No competing interests declared

Figures

Figure 1.
Figure 1.. Comparison between MSMAll and MSMSulc alignment on dual regression results from an individual subject.
(A) Single-subject ICA result from MSMAll data acts as ‘ground truth’. (B) Dual regression of this subject’s MSMAll data against MSMAll group maps captures subject-specific spatial organisation well. (C) Single-subject ICA result from MSMSulc data shows spatial misalignment in parietal regions compared to single-subject MSMAll ICA results shown in A (from which the black outline was derived). (D) Dual regression of this subject’s MSMSulc data against MSMAll group maps captures spatial organisation well, despite the observed spatial shift. These results illustrate dual regression being minimally affected by spatial misalignment. Note that the black outline in A, B, C reflects boundaries of MSMAll single subject results (shown in A), while the blue outline in D reflects boundaries of MSMSulc single subject results (shown in C). Data of Figure 1 is available on BALSA (https://balsa.wustl.edu/study/show/0Lwm6), where all 25 components can be viewed.
Figure 1—figure supplement 1.
Figure 1—figure supplement 1.. The effect of spatial misalignment on dual regression estimates was tested by comparing data that were aligned using MSMAll, MSMSulc, and volumetric alignment approaches.
(A) Correlation between group ICA maps and individual-subject ICA maps (which can be seen as the ‘ground truth’) is highest for MSMAll and lowest for MSMSulc. (B) Correlation between subject-specific dual regression spatial estimates (stage two maps) and individual-subject ground truth ICA maps show that dual regression can appropriately correct for minor misalignment between MSMSulc and MSMAll. However, dual regression spatial estimates from volumetrically aligned data are significantly less well matched to the ground truth maps. Coloured area represents one standard deviation (across 22 subjects).
Figure 2.
Figure 2.. Graphical summary of the estimation of temporal network matrices and spatial overlap matrices.
(A) Firstly, the full dataset is decomposed into a number of components/modes (the generic outer product model shown here is relevant to both ICA and PROFUMO). (B) Full Pearson’s correlation matrices are estimated from the elements shown in A (the subscript s refers to matrices that have been standardised over time for Y and T, and standardised over space for S; n=#TRs for the dense connectome and the temporal network matrix, and n=#grayordinates for the spatial overlap matrix). The correlation matrix of the full dataset (Y) results in a voxel-to-voxel matrix referred to as the ‘dense connectome’. The correlation matrices of the component maps or timeseries result in component-to-component matrices. Here, each element in the temporal network matrix describes the correlation between two timecourses (i.e., a temporal edge), whereas each element in the spatial overlap matrix describes the correlation between two spatial maps (i.e., a spatial edge).
Figure 3.
Figure 3.. Direct comparison of spatial and temporal edges estimated with dual regression (following group ICA).
Each point in the figure panels represents one edge in one subject (i.e., 1225 edges x 1004 subjects are shown). The results show that full temporal and full spatial edges obtained from ICA-DR are negatively correlated. This negative correlation largely persists when ‘outlier’ edges with a spatial correlation below −0.2 are removed from the comparison (r = −0.19).
Figure 4.
Figure 4.. Simulation results showing the effects of assuming spatial independence when there is spatial overlap between nodes.
(A) Spatial ICA leads to an underestimation of map weights in the overlapping area and an introduction of negative weights to meet the assumption of spatial independence. (B) The temporal correlation between timeseries (Tnet) as estimated by dual regression is a weighted sum of the ground truth temporal correlation and the ground truth spatial correlation, leading to a negative correlation between temporal and spatial (Snet) correlations estimated with ICA-DR. (C) Temporal correlations estimated with dual regression (orange) are inflated compared to the ground truth (blue). (D) Spatial correlations estimated with dual regression (orange) have a negative bias compared to the ground truth (blue). (E) Despite large shifts in temporal and spatial correlations observed in C and D, the accuracy of estimated timeseries (magenta) and spatial maps (green) is relatively high.
Figure 5.
Figure 5.. Overlap as estimated from data from the Human Connectome Project.
(A) The absolute sum across node maps reveals a cortical pattern of overlap regions. Overlap occurs most noticeably in the temporal-parietal-occipital junction, and the spatial organisation is similar between PROFUMO results (left) and ICA-DR results (right). As expected, overlap is somewhat more extensive in PROFUMO results compared with ICA-DR. (B) A specific example shows that overlap is increased between PFM maps, even when highly similar spatial maps are found with ICA-DR. Data for this figure is available on BALSA (https://balsa.wustl.edu/study/show/0Lwm6) where overlap between all map pairs can be visualised.
Figure 6.
Figure 6.. Summary schematic of the stages involved in the proposed thresholded dual regression procedure.
The timeseries output from Stage four should be used to perform further node-based analyses.
Figure 7.
Figure 7.. Simulation results to compare traditional ICA-DR, thresholded ICA-DR, and PROFUMO performance.
(A) Correlations between ground truth and estimated subject timeseries is high across all three methods. (B) Correlations between ground truth and estimated subject spatial maps is highest in PROFUMO results (red), and improved in thresholded ICA-DR results (blue) compared to traditional ICA-DR results (green). Similar results are found for cross-subject correlations of temporal network matrix edges (C), and for cross-subject correlations of spatial overlap matrix edges (D). Results in A-D are shown for all maps that achieved a minimum group-average spatial correlation between ground truth and estimated maps of r = 0.5 across the three methods. Figures E and F show results for a subset of edges with significantly positive spatial correlation. Here, the first ‘ground truth’ column shows the distribution of ground truth edge strengths, whereas columns 2–4 show the difference between estimated and ground truth edge strengths (i.e., results in columns 2–4 that are closest to zero are best).
Figure 7—figure supplement 1.
Figure 7—figure supplement 1.. Comparison across different simulations for the accuracy of temporal edge estimation (A), and for the accuracy of spatial edge estimation (B).
The ‘full simulation’ included both spatial overlap and spatial misalignment (this matches the results in Figure 6). The ‘no misalignment’ simulation was run with identical parameters, except that there was no misalignment between subjects. The ‘no overlap’ simulation was again run with identical parameters, except that spatial maps were forced to be uncorrelated at the level of individual subjects by running spatial ICA at this stage in the simulation prior to generating the data. Results show similar biases in spatial and temporal edge estimates from standard dual regression in the full and no misalignment simulations, indicating that this effect is observed irrespective of spatial misalignment. The no overlap simulation also shows improvement of thresholded dual regression over standard dual regression, likely as a result of the effective reduction of noise that is achieved when thresholding the maps. Note that there are no meaningful spatial edges in the ‘no overlap’ simulation, so it is expected that none of the methods estimate this.
Figure 8.
Figure 8.. Full and partial CCA results between spatial overlap (Snet) or temporal network (Tnet) matrices against behaviour.
The strongest association with behaviour is found for PFM spatial edges. Temporal network matrices estimated with thresholded ICA-DR (thres) are less strongly linked to behaviour than those estimated with traditional ICA-DR (orig), and show a greater reduction when partialling out matching spatial edges. The dashed line indicates the mean p<0.05 significance level from permutation testing.

References

    1. Arenas AL, Wolfers T, Mulders P, Beckmann CF. Inter-individual differences in human brain structure and morphometry link to population variation in demographics and behavior. bioRxiv. 2018 doi: 10.1101/413104. - DOI - PMC - PubMed
    1. Beckmann CF, DeLuca M, Devlin JT, Smith SM. Investigations into resting-state connectivity using independent component analysis. Philosophical Transactions of the Royal Society B: Biological Sciences. 2005;360:1001–1013. doi: 10.1098/rstb.2005.1634. - DOI - PMC - PubMed
    1. Beckmann CF, Smith SM. Probabilistic independent component analysis for functional magnetic resonance imaging. IEEE Transactions on Medical Imaging. 2004;23:137–152. doi: 10.1109/TMI.2003.822821. - DOI - PubMed
    1. Bielczyk NZ, Walocha F, Ebel PW, Haak KV, Llera A, Buitelaar JK, Glennon JC, Beckmann CF. Thresholding functional connectomes by means of mixture modeling. NeuroImage. 2018;171:402–414. doi: 10.1016/j.neuroimage.2018.01.003. - DOI - PMC - PubMed
    1. Bijsterbosch JD, Smith SM, Beckmann CF. In: Introduction to Resting State fMRI Functional Connectivity. Jenkinson M, Chappell M, editors. Oxford University Press; 2017.

Publication types