Editorial
. 2019 May 8;15(5):e1006917.
doi: 10.1371/journal.pcbi.1006917. eCollection 2019 May.

The statistics of epidemic transitions

Affiliations
Editorial

The statistics of epidemic transitions

John M Drake et al. PLoS Comput Biol. .

Abstract

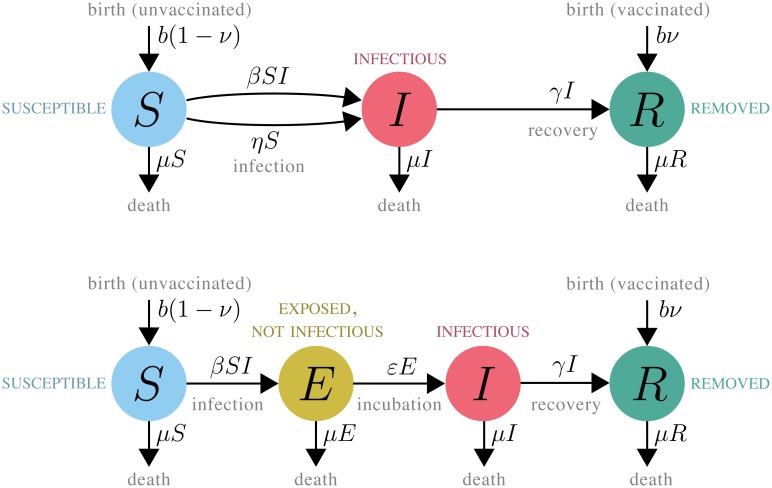
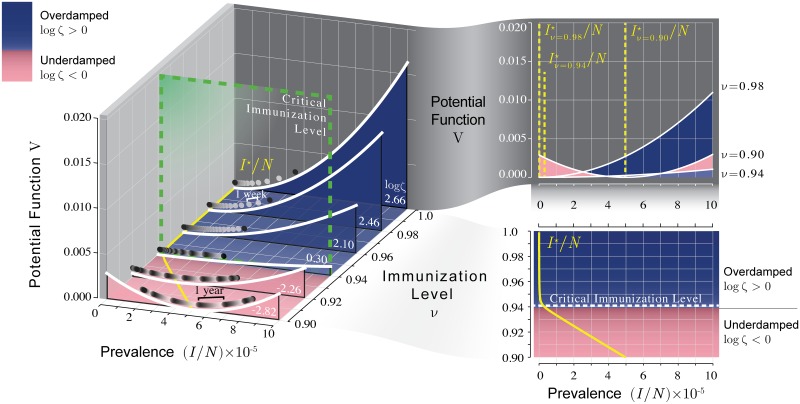
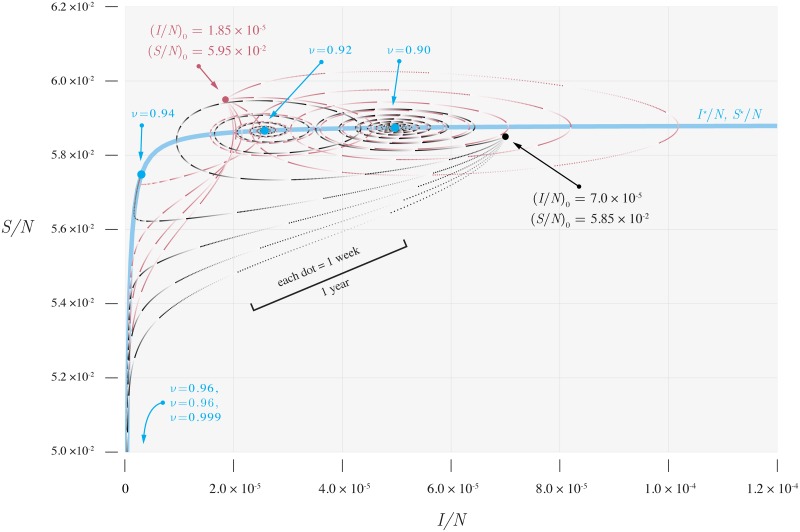
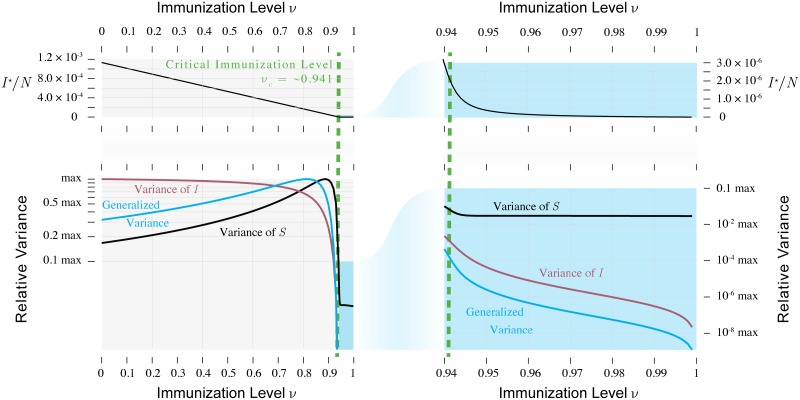
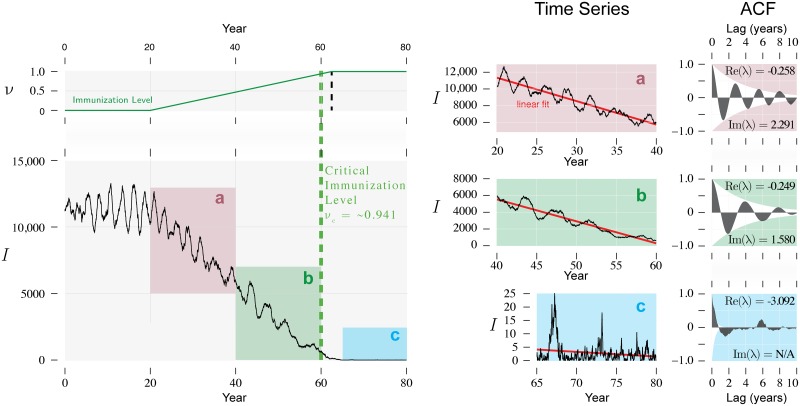
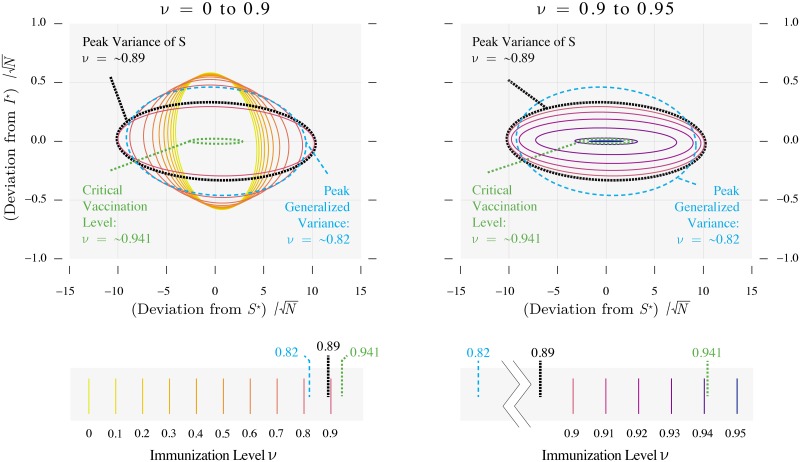
Emerging and re-emerging pathogens exhibit very complex dynamics, are hard to model and difficult to predict. Their dynamics might appear intractable. However, new statistical approaches-rooted in dynamical systems and the theory of stochastic processes-have yielded insight into the dynamics of emerging and re-emerging pathogens. We argue that these approaches may lead to new methods for predicting epidemics. This perspective views pathogen emergence and re-emergence as a "critical transition," and uses the concept of noisy dynamic bifurcation to understand the relationship between the system observables and the distance to this transition. Because the system dynamics exhibit characteristic fluctuations in response to perturbations for a system in the vicinity of a critical point, we propose this information may be harnessed to develop early warning signals. Specifically, the motion of perturbations slows as the system approaches the transition.


Conflict of interest statement

The authors have declared that no competing interests exist.

Figures

Fig 1
Fig 1. The SIR and SEIR models.
Fig 2
Fig 2. Critical slowing down is illustrated in the potential function of the linearized SIR model.
Disease prevalence (I/N) is represented by the horizontal position of a ball sliding through viscous fluid in a well having a height determined by the potential function. Both the depth of the well and the viscosity of the fluid in the equivalent physical system are affected by vaccine coverage. The well is shallowest near the immunization threshold, which illustrates the slowing down of the dynamics as the critical point (νc ≈ 0.941; green dashed line) is approached. Oscillatory dynamics occur at another immunization level (ν ≈ 0.939) corresponding to the system becoming underdamped (pink region). Model parameters: b = 2 × 10⁵ y−1, μ = 0.02 y−1, γ = 365/22 y−1, η = 2 × 10⁻⁵ y−1, R0 = 17. To write the potential function in terms of prevalence, we scaled the deviations of the linearized system by the square root of the equilibrium population size (i.e., scaled by b/μ). Critical slowing down is seen in this figure in the relative magnitude of the displacement of the ball with respect to the distance from the critical level of immunization.
Fig 3
Fig 3. Dynamics of deterministic component of SIR model.
Dynamics of the deterministic component of the SIR model (Eq 1) as a function of vaccine uptake. The motion becomes slower as the vaccine uptake approaches the threshold. Parameters are as in Fig 2.
Fig 4
Fig 4. Variance as a function of vaccine uptake.
The variance of S and the generalized variance peak near the threshold, whereas the variance of I always decreases as vaccine uptake increases. The right panel shows that the variance of S would not be as informative as that of I for an approach to the threshold from above. Parameters are as in Fig 2.
Fig 5
Fig 5. Dynamics of the number infected in a slow approach to elimination.
Critical slowing down does not lead to an increase in the variance of this variable as the immunization threshold is approached. However, critical slowing down can still be observed from the decrease in the frequency of oscillations in the autocorrelation function (ACF). Vaccine uptake ν increasing 0.025/year from ν = 0 in year 20. Other parameters are as in Fig 2.
Fig 6
Fig 6. Bivariate spread of the deviations from the equilibrium as a function of vaccine uptake.
The ellipses indicate the area containing the deviations 95% of the time. The area of the ellipse is largest in the vicinity of the threshold immunization level, which is consistent with the common result that critical slowing down leads to increases in variance. Parameters are as in Fig 2.

References

    1. Morens D, Folkers G, Fauci A. The challenge of emerging and re-emerging infectious diseases. Nature. 2004;430(6996):242–249. 10.1038/nature02759 - DOI - PMC - PubMed
    1. Dayan GH, Quinlisk MP, Parker AA, Barskey AE, Harris ML, Schwartz JMH, et al. Recent resurgence of mumps in the United States. The New England Journal of Medicine. 2008;358(15):1580–1589. 10.1056/NEJMoa0706589 - DOI - PubMed
    1. Rohani P, Drake JM. The decline and resurgence of pertussis in the US. Epidemics. 2011;3(3-4):183–188. 10.1016/j.epidem.2011.10.001 - DOI - PubMed
    1. Jones KE, Patel NG, Levy MA, Storeygard A, Balk D, Gittleman JL, et al. Global trends in emerging infectious diseases. Nature. 2008;451(7181):990–993. 10.1038/nature06536 - DOI - PMC - PubMed
    1. Morse SS, Mazet JA, Woolhouse M, Parrish CR, Carroll D, Karesh WB, et al. Prediction and prevention of the next pandemic zoonosis. Lancet. 2012;380(9857):1956–1965. 10.1016/S0140-6736(12)61684-5 - DOI - PMC - PubMed

Publication types