Winter temperature correlates with mtDNA genetic structure of yellow-necked mouse population in NE Poland
- PMID: 31067251
- PMCID: PMC6505929
- DOI: 10.1371/journal.pone.0216361
Winter temperature correlates with mtDNA genetic structure of yellow-necked mouse population in NE Poland
Abstract
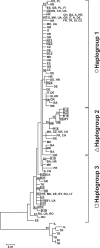
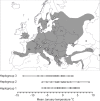
We analysed a fragment (247 bp) of cytochrome b of mitochondrial DNA sequenced using 353 samples of yellow-necked mice Apodemus flavicollis trapped in seven forests and along three woodlot transects in north-eastern Poland. Our aims were to identify the phylogeographic pattern and mtDNA structure of the population and to evaluate the role of environmental conditions in shaping the spatial pattern of mtDNA diversity. We found out that three European haplogroups occurred sympatrically in north-eastern Poland. Inferences based on mtDNA haplotype distribution and frequency defined five subpopulations. The mtDNA-based structure of mice significantly correlated with winter temperature: frequency of Haplogroup 1 was positively, and that of Haplogroup 3 negatively correlated to mean temperature of January in the year of trapping. Synthesis of the published pan-European data on the species phylogeography also showed that the possibly 'thermophilous' Haplogroup 1 has the westernmost occurrence, whereas the more 'cold-resistant' Haplogroup 3 occurs much further to north-east than the other haplogroups. The observed patter may be a byproduct of the tight coevolution with nuclear genes, as we have earlier found that - in mice population in NE Poland - the spatial pattern of nuclear DNA was best explained by January temperature. Alternatively, the observed association of mitochondrial genetic variation with temperature is possible to be adaptive as cytochrome b is involved in the process of ATP production via oxidative phosphorylation.
Conflict of interest statement
The authors have declared that no competing interests exist.
Figures


References
-
- Taberlet P, Fumagalli L, Wust-Saucy AG, Cosson JF. Comparative phylogeography and postglacial colonization routes in Europe. Molecular Ecology. 1998. April;7(4):453–64. - PubMed
-
- Deffontaine V LR, Kotlik P, Sommer R, Nieberding C, Paradis E, Searle JB, et al. Beyond the Mediterranean peninsulas: evidence for central European glacial refugia for a temperate mammal species, the bank vole (Clethrionomys glareolus). Molecular Ecology. 2005;14:1727–39. 10.1111/j.1365-294X.2005.02506.x - DOI - PubMed
-
- Wójcik JM, Kawalko A, Markova S, Searle JB, Kotlik P. Phylogeographic signatures of northward post-glacial colonization from high-latitude refugia: a case study of bank voles using museum specimens. Journal of Zoology. [Article]. 2010. August;281(4):249–62.
-
- Sommer RS, Fahlke JM, Schmölcke U, Benecke N, Zachos FE. Quaternary history of the European roe deer Capreolus capreolus. Mammal Review. 2009. January;39(1):1–16.
Publication types
MeSH terms
Substances
LinkOut - more resources
Full Text Sources

