. 2019 May 8;14(5):e0215846.
doi: 10.1371/journal.pone.0215846. eCollection 2019.

Live fast, die young: Accelerated growth, mortality, and turnover in street trees

Affiliations

Live fast, die young: Accelerated growth, mortality, and turnover in street trees

Ian A Smith et al. PLoS One. .

Abstract

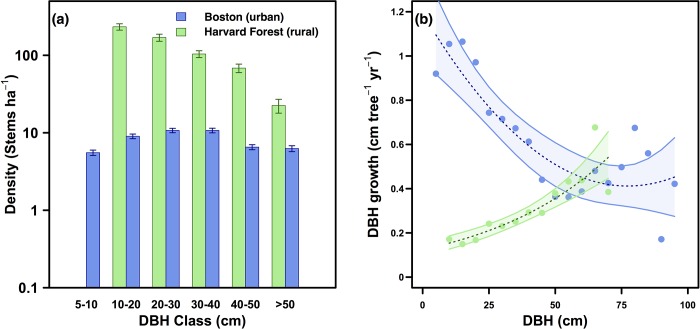
Municipalities are embracing greening initiatives as a key strategy for improving urban sustainability and combatting the environmental impacts of expansive urbanization. Many greening initiatives include goals to increase urban canopy cover through tree planting, however, our understanding of street tree ecosystem dynamics is limited and our understanding of vegetation structure and function based on intact, rural forests does not apply well to urban ecosystems. In this study, we estimate size-specific growth, mortality, and planting rates in trees under municipal control, use a box model to forecast short-term changes in street tree aboveground carbon pools under several planting and management scenarios, and compare our findings to rural, forested systems. We find accelerated rates of carbon cycling in street trees with mean diameter growth rates nearly four times faster in Boston, MA, USA (0.78 ± 0.02 cm yr-1) than in rural forest stands of MA (0.21 ± 0.02 cm yr-1) and mean mortality rates more than double rural forested rates (3.06 ± 0.25% yr-1 in street trees; 1.41 ± 0.04% yr-1 in rural trees). Despite the enhanced growth of urban trees, high mortality losses result in a net loss of street tree carbon storage over time (-0.15 ± 0.09 Mg C ha-1 yr-1). Planting initiatives alone may not be sufficient to maintain or enhance canopy cover and biomass due to the unique demographics of urban ecosystems. Initiatives to aid in the establishment and preservation of tree health are central for increasing street tree canopy cover and maintaining/increasing carbon storage in vegetation. Strategic combinations of planting and maintenance will maximize the viability of greening initiatives as an effective climate mitigation tool.


Conflict of interest statement

The authors have declared that no competing interests exist.

Figures

Fig 1
Fig 1. Census and survey transects.
2014 survey transects (red) overlaid on UEI surveyed trees (blue). Letters represent group ID’s corresponding to the 10 consolidated neighborhood groups. See S2 Table for neighborhood descriptions and statistics. Sources: Esri, Garmin, HERE, INCREMENT P, OpenStreetMap contributors, and the GIS community.
Fig 2
Fig 2. Stem density & growth.
a) Stem density in 2014 (stems ha-1) shown on a log scale. b) DBH growth (cm tree-1 yr-1) in Boston and at Harvard Forest, binned by 5 cm DBH classes. A 2nd-order polynomial regression model and exponential growth model with 95% confidence intervals are fit to the observations in Boston and Harvard Forest, respectively (Boston: R2 = 0.75, p-value < .001; HF: R2 = 0.87, p-value < .001).
Fig 3
Fig 3. Mortality.
Mortality rates in Boston and at Harvard Forest (% stems yr-1), binned by DBH. 2nd-order polynomial regression models with 95% confidence interval are fit to the observations (Boston: R2 = 0.63, p-value < .001; HF: R2 = 0.92, p-value < .001).
Fig 4
Fig 4. Neighborhood C balance.
a) Neighborhood group net carbon flux (Mg C ha-1 yr-1) throughout the City of Boston as a balance of biomass change due to mortality, recruitment, and tree growth between 2006 and 2014. Error bars represent standard error. Numbers above bars represent 2014 biomass stock (Mg C ha-1). See S2 Table for neighborhood descriptions and statistics.
Fig 5
Fig 5. Projected C storage.
Projected aboveground carbon pools at rural Harvard Forest (a) and in urban Boston street trees (b) between 2006 and 2030. Triangles represent 2006 observations ± 95% CI and squares represent 2014 observations ± 95% CI. Pools are broken up by size class with the total carbon storage represented in red. Models were run 1000 times and shaded polygons represent the middle 95% of model observations. Model structure and parameters can be found in S1 Fig.
Fig 6
Fig 6. Scenarios.
Projected aboveground carbon pools in Boston street trees between 2014 and 2030 under various changes to current planting and maintenance regimes. Triangles represent 2014 observations with a 95% confidence interval. Pools are broken up by size class with the total carbon storage represented in red. Models were run 1000 times and shaded polygons represent the middle 95% of model observations.
Fig 7
Fig 7. Mortality probability.
Cumulative probability of mortality (%) vs. DBH (cm) for a 10 cm DBH tree in an urban vs. rural environment over a 35 year period. Points represent 5 year increments. Inset: Annual mortality rates (%) vs. DBH (cm) in Boston and at the Harvard Forest. Solid arrows represent the trajectory of the 10 cm DBH tree after 35 years.

References

    1. Seto KC, Guneralp B, Hutyra LR. Global forecasts of urban expansion to 2030 and direct impacts on biodiversity and carbon pools. Proc Natl Acad Sci U S A. 2012;109(40):16083–8. 10.1073/pnas.1211658109 - DOI - PMC - PubMed
    1. Bowler DE, Buyung-Ali L, Knight TM, Pullin AS. Urban greening to cool towns and cities: A systematic review of the empirical evidence. Landsc Urban Plan. 2010;97(3):147–55.
    1. Yao L, Chen L, Wei W, Sun R. Potential reduction in urban runoff by green spaces in Beijing: A scenario analysis. Urban For Urban Green. 2015;14(2):300–8.
    1. South EC, Hohl BC, Kondo MC, MacDonald JM, Branas CC. Effects of Greening Vacant Land on Mental Health of Community-Dwelling Adults. JAMA Network Open. 2018;1(3):e180298 10.1001/jamanetworkopen.2018.0298 - DOI - PMC - PubMed
    1. Roman LA. How many trees are enough? Tree death and the urban canopy. Scenario Journal. Scenario 04. 2014. 8p. Available from: https://www.fs.fed.us/nrs/pubs/jrnl/2014/nrs_2014_roman_001.pdf

Publication types