. 2019 May 8;14(5):e0216596.
doi: 10.1371/journal.pone.0216596. eCollection 2019.

Magnetic resonance imaging of mouse brain networks plasticity following motor learning

Affiliations

Magnetic resonance imaging of mouse brain networks plasticity following motor learning

Alexandra Badea et al. PLoS One. .

Abstract

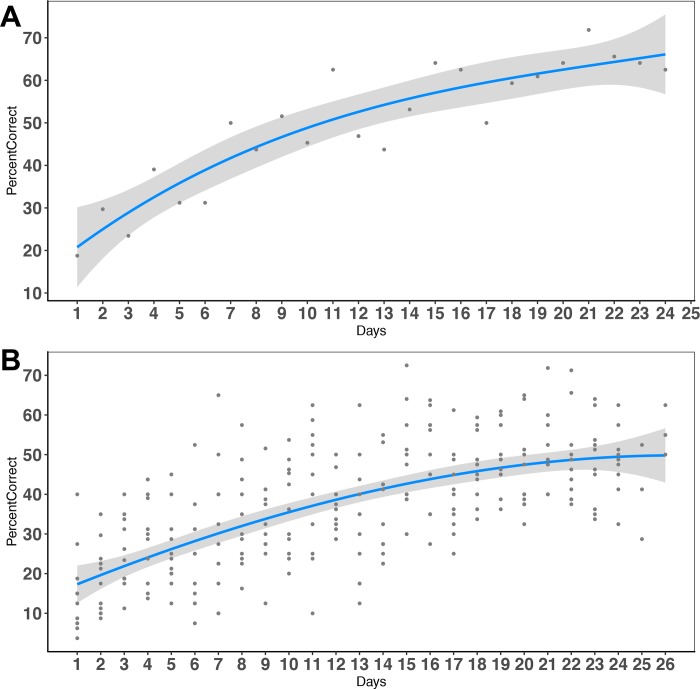
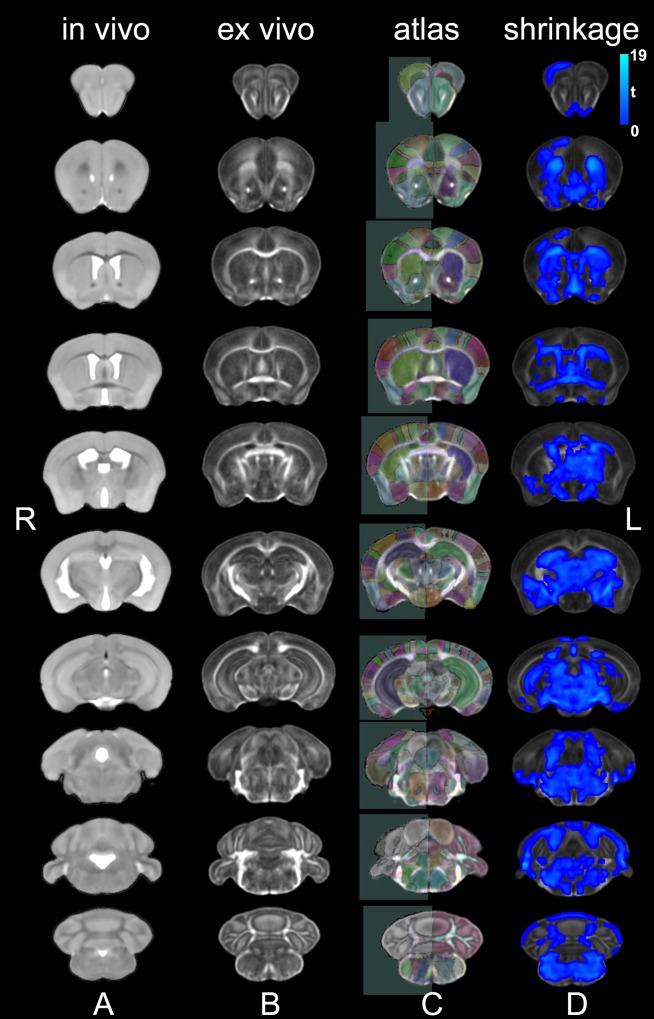
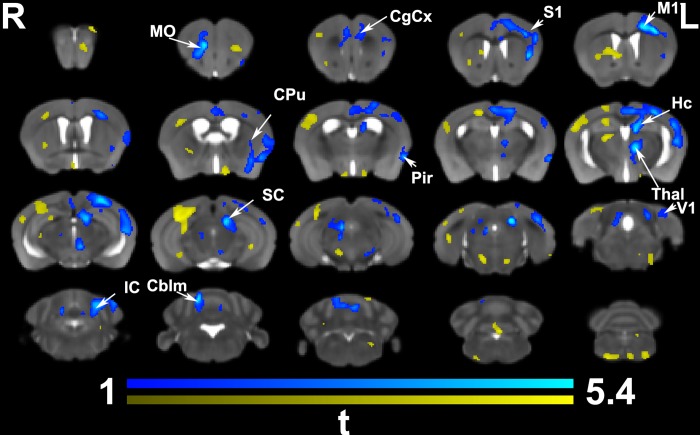
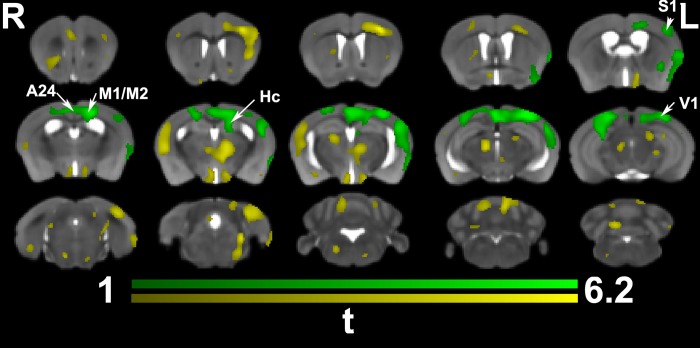
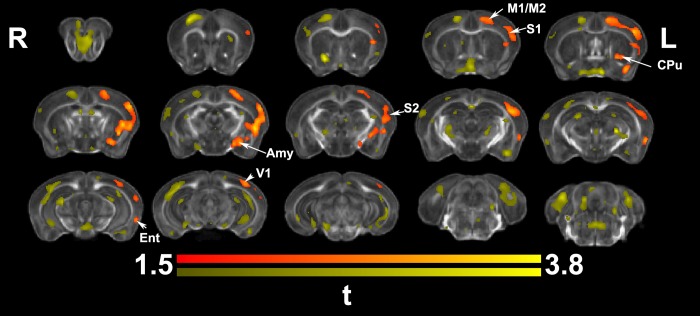
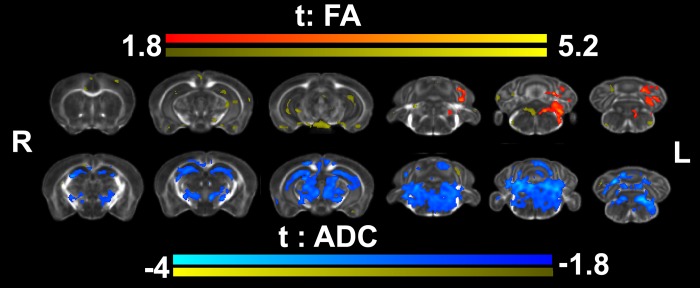
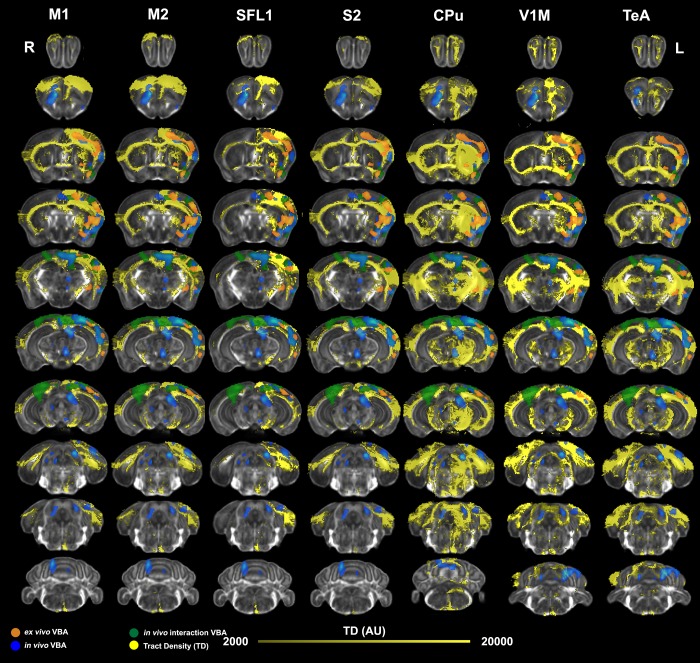
We do not have a full understanding of the mechanisms underlying plasticity in the human brain. Mouse models have well controlled environments and genetics, and provide tools to help dissect the mechanisms underlying the observed responses to therapies devised for humans recovering from injury of ischemic nature or trauma. We aimed to detect plasticity following learning of a unilateral reaching movement, and relied on MRI performed with a rapid structural protocol suitable for in vivo brain imaging, and a longer diffusion tensor imaging (DTI) protocol executed ex vivo. In vivo MRI detected contralateral volume increases in trained animals (reachers), in circuits involved in motor control, sensory processing, and importantly, learning and memory. The temporal association area, parafascicular and mediodorsal thalamic nuclei were also enlarged. In vivo MRI allowed us to detect longitudinal effects over the ~25 days training period. The interaction between time and group (trained versus not trained) supported a role for the contralateral, but also the ipsilateral hemisphere. While ex vivo imaging was affected by shrinkage due to the fixation, it allowed for superior resolution and improved contrast to noise ratios, especially for subcortical structures. We examined microstructural changes based on DTI, and identified increased fractional anisotropy and decreased apparent diffusion coefficient, predominantly in the cerebellum and its connections. Cortical thickness differences did not survive multiple corrections, but uncorrected statistics supported the contralateral effects seen with voxel based volumetric analysis, showing thickening in the somatosensory, motor and visual cortices. In vivo and ex vivo analyses identified plasticity in circuits relevant to selecting actions in a sensory-motor context, through exploitation of learned association and decision making. By mapping a connectivity atlas into our ex vivo template we revealed that changes due to skilled motor learning occurred in a network of 35 regions, including the primary and secondary motor (M1, M2) and sensory cortices (S1, S2), the caudate putamen (CPu), visual (V1) and temporal association cortex. The significant clusters intersected tractography based networks seeded in M1, M2, S1, V1 and CPu at levels > 80%. We found that 89% of the significant cluster belonged to a network seeded in the contralateral M1, and 85% to one seeded in the contralateral M2. Moreover, 40% of the M1 and S1 cluster by network intersections were in the top 80th percentile of the tract densities for their respective networks. Our investigation may be relevant to studies of rehabilitation and recovery, and points to widespread network changes that accompany motor learning that may have potential applications to designing recovery strategies following brain injury.


Conflict of interest statement

The authors have declared that no competing interests exist.

Figures

Fig 1
Fig 1. Skilled prehension task performance.
A. Learning performance in a representative mouse. B. Average learning performance for all mice trained in the skilled prehension task, modeled with a 3rd order polynomial. The average on the last day of training was 55.13±8.24%.
Fig 2
Fig 2. In vivo and ex vivo study specific templates normalized into a 3rd generation Waxholm space.
We created study specific templates for in vivo T2-weighted FSE images (A) and ex vivo DTI parametric images. The transforms used to register the DWI contrasts were re-used to generate the FA template, with good contrast for gray/white matter boundaries (B). We automatically segmented 332 regions for the ex vivo specimens based on a reference atlas [28] (C). A comparison of the in vivo versus ex vivo images revealed areas of shrinkage (blue) in control specimens. The statistical tmaps were cluster-corrected for multiple comparisons, using an FDR threshold of 5%, and an initial cluster forming threshold significance level of 0.05 (D).
Fig 3
Fig 3. In vivo voxel based morphometry identified areas of significant enlargement in trained animals relative to the controls.
These areas were found in the bilateral medial orbital cortex (MO) and cingulate cortex (CgCx) (A32), as well is in the contralateral (left) cingulate cortex (A24, and 29), primary motor (M1), somatosensory (S1), caudate putamen (CPu), and hippocampus (Hc); and the visual (V1) cortex. In addition, clusters of hypertrophy covered areas of the thalamus (Thal; e.g. the parafascicular and mediodorsal nuclei), the superior (SC) and inferior colliculi (IC), and cerebellum (Cblm). The ipsilateral piriform cortex (Pir) was enlarged. Results are presented as tmaps, FDR cluster-corrected for multiple comparisons using an initial cluster forming threshold of 0.05 significance and the whole brain as a mask (blue color). Uncorrected statistical maps (shown in yellow) suggested involvement of the ipsilateral hemisphere as well.
Fig 4
Fig 4. In vivo voxel based morphometry identified a significant interaction between time and training.
Trained animals showed significant enlargement prominently in the contralateral (but also ipsilateral) cingulate cortex (A24, and 29), M1, S1, and the visual cortex (V1). The contralateral hippocampus, and corpus callosum, under the M1 were also enlarged. Results are presented as tmaps, FDR cluster-corrected for multiple comparisons using an initial cluster forming threshold of 0.05 significance, and the whole brain as a mask (green color). Uncorrected statistical maps (yellow) suggested involvement of the ipsilateral hemisphere.
Fig 5
Fig 5. Ex vivo voxel based morphometry identified areas of significant enlargement in trained animals relative to controls.
These were located in the contralateral (left) M1, S1, S2, CPu, amygdala (Amy), as well as the visual (V1) and entorhinal cortex (Ent). Results are presented as tmaps, FDR cluster-corrected for multiple comparisons using an initial cluster forming threshold of 0.05 significance and the whole brain as a mask (orange color). Uncorrected statistical maps (yellow), suggested involvement of the ipsilateral hemisphere as well, and a role for the hippocampus.
Fig 6
Fig 6. Voxel based analyses for fractional anisotropy (FA) and apparent diffusion coefficient (ADC) detected increased FA and decreased ADC in trained reachers relative to controls.
These occurred mostly in caudal regions such as the cerebellum and brainstem (ADC), but largely missed the motor and sensory cortices, although decreased ADC values were detected in the corpus callosum, below M1. Results are presented as tmaps, FDR cluster-corrected for multiple comparisons using an initial cluster forming threshold of 0.05 significance, and the whole brain as a mask. Uncorrected statistical maps are also shown in yellow, suggesting microstructural changes in the hippocampus and isocortex.
Fig 7
Fig 7. Mapping of ex vivo VBA-M and tract based connectivity maps.
To verify the overlap between morphometric changes detected ex vivo and circuits relevant to motor learning, we registered tract based connectivity maps [18] for individual seed regions to the minimum deformation template from our ex vivo study. We examined networks seeded in regions found to be enlarged in the contralateral (left) hemisphere, including the primary and secondary motor cortices (M1, and M2), as well as the primary and secondary somatosensory cortices (S1 –the forelimb region, S2), caudate putamen (CPu), V1M primary visual cortex (monocular); and the temporal association cortex (TeA). Significant clusters for in vivo morphometry at the terminal point are shown in blue, the interaction of time by group (trained versus not trained) in green, and the morphometric results from ex vivo specimens are shown in orange. These clusters showed good overlap with the tract density maps (TD).

References

    1. Chao FL, Zhang L, Zhang Y, Zhou CN, Jiang L, Xiao Q, et al. Running exercise protects against myelin breakdown in the absence of neurogenesis in the hippocampus of AD mice. Brain Res. 2018;1684(3):50–9. - PubMed
    1. Kleim JA, Jones TA, Schallert T. Motor enrichment and the induction of plasticity before or after brain injury. Neurochem Res. 2003;28(11):1757–69. - PubMed
    1. Baker LD, Frank LL, Foster-Schubert K, Green PS, Wilkinson CW, McTiernan A, et al. Effects of aerobic exercise on mild cognitive impairment: a controlled trial. Arch Neurol. 2010;67(1):71–9. 10.1001/archneurol.2009.307 - DOI - PMC - PubMed
    1. Hotting K, Roder B. Beneficial effects of physical exercise on neuroplasticity and cognition. Neurosci Biobehav Rev. 2013;37(9 Pt B):2243–57. - PubMed
    1. Swain RA, Harris AB, Wiener EC, Dutka MV, Morris HD, Theien BE, et al. Prolonged exercise induces angiogenesis and increases cerebral blood volume in primary motor cortex of the rat. Neuroscience. 2003;117(4):1037–46. - PubMed

Publication types