

doi: 10.1089/ast.2016.1551.
The Mars Organic Molecule Analyzer (MOMA) Instrument: Characterization of Organic Material in Martian Sediments
Affiliations
- PMID: 31067288
- PMCID: PMC5685156
- DOI: 10.1089/ast.2016.1551
Item in Clipboard
The Mars Organic Molecule Analyzer (MOMA) Instrument: Characterization of Organic Material in Martian Sediments
Astrobiology.
.
Abstract
The Mars Organic Molecule Analyzer (MOMA) instrument onboard the ESA/Roscosmos ExoMars rover (to launch in July, 2020) will analyze volatile and refractory organic compounds in martian surface and subsurface sediments. In this study, we describe the design, current status of development, and analytical capabilities of the instrument. Data acquired on preliminary MOMA flight-like hardware and experimental setups are also presented, illustrating their contribution to the overall science return of the mission. Key Words: Mars-Mass spectrometry-Life detection-Planetary instrumentation. Astrobiology 17, 655-685.
Conflict of interest statement
No competing financial interests exist.
Figures

The different parts of MOMA and their contributors (France (F), Germany (D), United States) are displayed in the figure above. The LPU that controls the LH is mounted as a slice on the MEB (top right). Sample carousel (SC) and refillable sample container are not part of MOMA. LH, Laser Head; LPU, Laser Pump Unit; MEB, Main Electronic Box; MOMA, Mars Organic Molecule Analyzer.
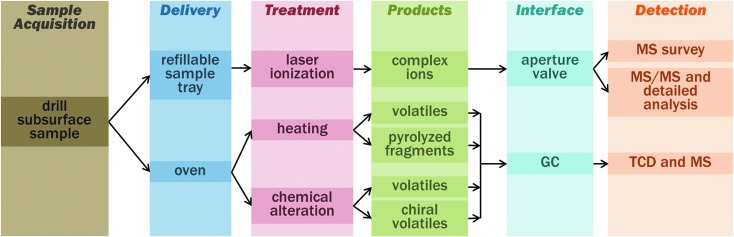
Chain of sample processing and analysis. The subsurface sample is received from drill and crushing station. Important decisional points are the MOMA operational mode, in particular, choose delivery to refillable sample tray/laser ionization versus pyrolysis oven and select chemical alteration (derivatization agent) and GC column. In the latter case, the signal is generally detected by both MS and TCD (Section 6.2.2). GC, Gas Chromatography; MS, Mass Spectrometer; TCD, Thermal Conductivity Detector.

(a) MTBSTFA/DMF derivatization reaction with a carboxylic acid. (b) DMF-DMA derivatization reaction with an amino acid. The asymmetric center (*) is conserved.

Overview of the space-compatible sample treatment for in situ GCMS analysis. Release of oxygen and chlorine from oxychlorine species in the temperature range 200–600°C (Archer et al., 2016) competes with MTBSTFA derivatization and thermochemolysis. GCMS, Gas Chromatography–Mass Spectrometry.

Picture of an MOMA derivatization capsule. The inset shows the same capsule next to a metric length scale (the smallest subdivision is 1 mm). The cylindrical container is 4.3 mm high and 3.2 mm in diameter (external dimensions). The 4-mm-long shaft (in the right part of the image) is the remaining part of the filling port.

Top: Simplified gas flow diagram of MOMA GC. Volatiles derived from the sample are carried by a steady helium flow, trapped, and concentrated in one of the adsorption traps and thermally released in backflush mode. Finally, the volatiles are separated by one of the GC columns (MXT CLP, MXT Q Bond, CP Chirasil Dex CB, or MXT 5) and detected by both TCD and ITMS, except in the case of MXT 5, where the separated compounds are detected by ITMS only. Bottom: GC QSM as of March 2016 with zoom of the adsorption traps. ITMS, Ion Trap Mass Spectrometer; QSM, Qualification Simulator Model.

Separation of volatile compounds (butane, pentane, hexane, and benzene). The chromatogram obtained shows good separation of the four compounds injected in both the MS (above) and TCD (below) signals. The double peak observed on the TCD signal at a retention time of 0.85 min is due to the presence of air, which is not observed by the MS as it is below its mass range. MS, Mass Spectrometer.

MS chromatogram for separation of the mixture of phenylethanol, 1-butanol, methyl-acetate, hexane, benzene, toluene, dodecane, heptanol, pentanol, fluoronaphthalene, and dimethylformamide diluted in methanol. Methyl acetate and methanol were not detected by the MS since these molecules (or their heaviest fragments) have masses below its mass cutoff set to m/z ∼ 40.

Left: MOMA laser subsystem highlighted in red: LH mounted to the side of the MOMA-MS housing (Fig. 1). Middle: Photograph of the ETU LH and (right) UV beam profile at the sample location for high-energy output of the ETU laser. ETU, Engineering Test Unit.

Flow diagram for MOMA operating modes. Quick survey analyses will only use subsample #1. Experiment cycles and vertical surveys will use subsamples #1 and #2 and, depending on quick assessment of the data, also subsamples #3 and #4. Direct detection of CO2 and NO2 (mentioned in the flow diagram) may or may not be possible, depending on the mass cutoff of the MS.

Positive ion LDMS spectrum of chlorite alone (top) and chlorite doped 0.01 w% with example PAH coronene. In this example case, the Coronene molecular ion is readily detectable above the very low background contributed by the mineral analog. LDMS, laser desorption mass spectrometry.

GCMS chromatograms (total ion current) of stepwise pyrolysis (300°C, 500°C, 700°C). Open and filled circles indicate n-alkenes and n-alkanes, respectively; X indicates contaminants; and numbers indicate aromatic compounds (Table 6). Note that in the 500°C and 700°C chromatograms, only a small selection of peaks are marked; for further details, see Figure 13.

GCMS chromatograms of stepwise pyrolysis filtered for certain compounds. (a)
n-Alkenes and n-alkanes (500°C, m/z 69, 71, 83, 85), (b) benzene and alkylbenzenes (700°C, m/z 78, 91, 92, 105, 106, 119, 120), (c) naphthalene and alkylnaphthalenes (700°C, m/z 128, 141, 142, 155, 156, 170), and (d) phenanthrene, anthracene, and methylphenanthrenes (700°C, m/z 178, 191, 192). Open and filled circles indicate n-alkenes and n-alkanes, respectively; X indicates contaminants; numbers indicate aromatic compounds (Table 6).

GCMS chromatograms (total ion current) of the MTBSTFA/DMF derivatization. (a) Blank run with MTBSTFA/DMF, (b) derivatization of the sample with MTBSTFA/DMF. No major differences are noted.
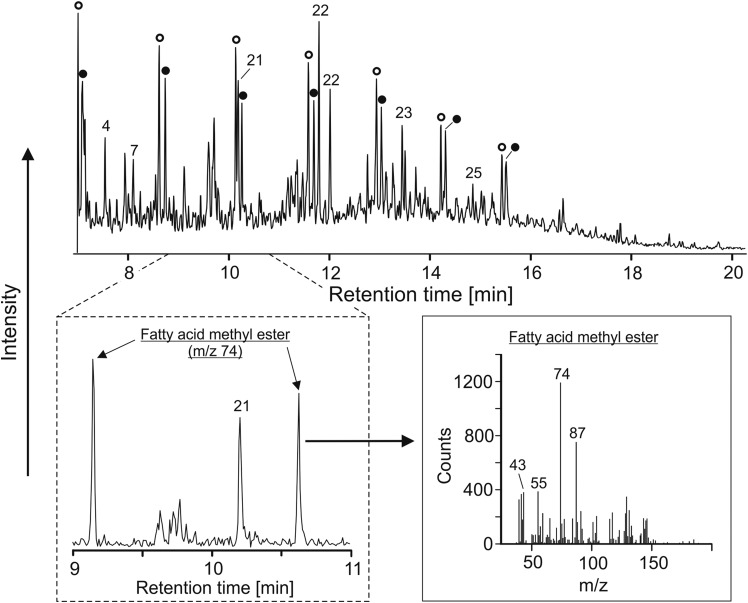
GCMS chromatograms of TMAH thermochemolysis. Top: total ion current, similar to pyrolysis. Bottom left: part of the chromatogram (m/z 74) with identified fatty acid methyl esters. Bottom right: corresponding mass spectrum of fatty acid methyl esters. Open and filled circles indicate n-alkenes and n-alkanes, respectively; numbers indicate aromatic compounds (Table 6). TMAH, tetramethylammonium hydroxide.
References
-
- Archer P.D., Jr., Ming D.W., and Sutter B. (2013) The effects of instrument parameters and sample properties on thermal decomposition: interpreting thermal analysis data from Mars. Planet Sci 2:2
-
- Archer P.D., Jr., Ming D.W., Sutter B., Morris R.V., Clark B.C., Mahaffy P.H., Wray J.J., Fairen A.G., Gellert R., Yen A.S., Blake D.F., Vaniman D.T., Glavin D.P., Eigenbrode J.L., Trainer M.G., Navarro-González R., McKay C.P., and Freissinet C. (2016) Oxychlorine species on Mars: implications from Gale Crater samples. 47th Lunar and Planetary Science Conference (2016) 2947.pdf
-
- Arevalo R., Brinckerhoff W., van Amerom F., Danell R., Pinnick V., Li X., Getty S., Hovmand L., Grubisic A., Mahaffy P., Goesmann F., and Steininger H. (2015) Design and demonstration of the Mars Organic Molecule Analyzer (MOMA) on the ExoMars 2018 rover. Aerospace Conference, 2015 IEEE doi: 10.1109/AERO.2015.7119073 - DOI
-
- Bada J.L. and McDonald G.D. (1995) Amino acid racemization on Mars: implications for the preservation of biomolecules from an extinct martian biota. Icarus 114:139–143 - PubMed
LinkOut - more resources
Full Text Sources
Miscellaneous