. 2019 May 7;27(6):1637-1649.e6.
doi: 10.1016/j.celrep.2019.04.047.

The Hippo Pathway Blocks Mammalian Retinal Müller Glial Cell Reprogramming

Affiliations

The Hippo Pathway Blocks Mammalian Retinal Müller Glial Cell Reprogramming

Elda M Rueda et al. Cell Rep. .

Abstract

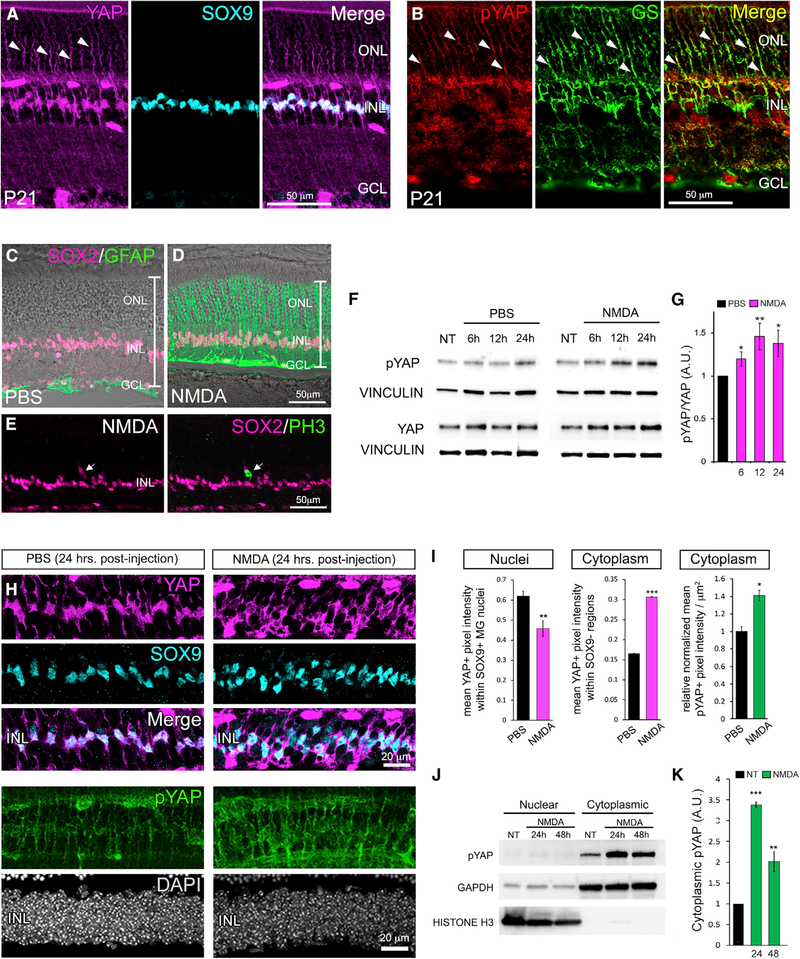
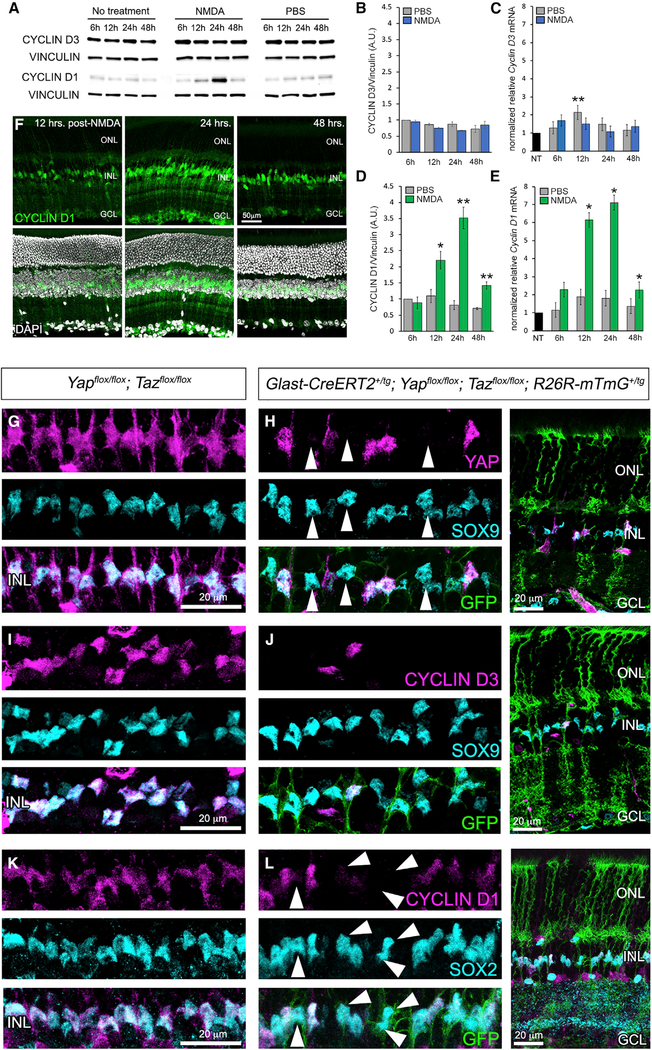
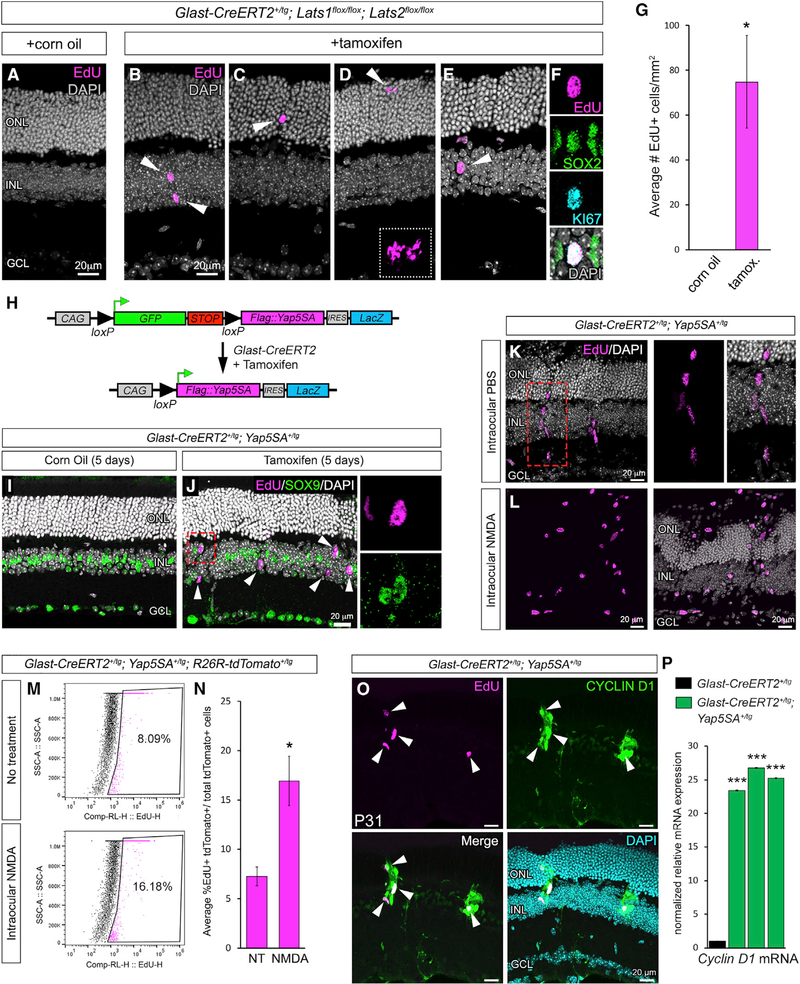
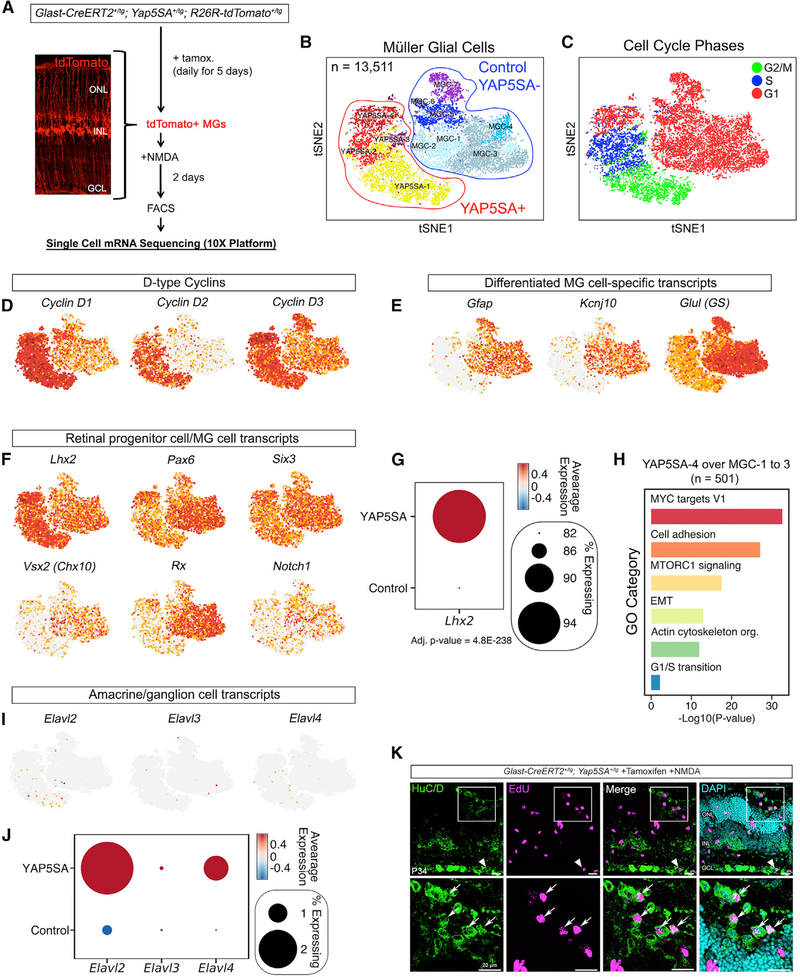
In response to retinal damage, the Müller glial cells (MGs) of the zebrafish retina have the ability to undergo a cellular reprogramming event in which they enter the cell cycle and divide asymmetrically, thereby producing multipotent retinal progenitors capable of regenerating lost retinal neurons. However, mammalian MGs do not exhibit such a proliferative and regenerative ability. Here, we identify Hippo pathway-mediated repression of the transcription cofactor YAP as a core regulatory mechanism that normally blocks mammalian MG proliferation and cellular reprogramming. MG-specific deletion of Hippo pathway components Lats1 and Lats2, as well as transgenic expression of a Hippo non-responsive form of YAP (YAP5SA), resulted in dramatic Cyclin D1 upregulation, loss of adult MG identity, and attainment of a highly proliferative, progenitor-like cellular state. Our results reveal that mammalian MGs may have latent regenerative capacity that can be stimulated by repressing Hippo signaling.

Keywords: Hippo pathway; LATS; Müller glia; YAP; regeneration; reprogramming; retina.


Conflict of interest statement

DECLARATION OF INTERESTS

The authors declare no competing interests.

Figures

Figure 1.
Figure 1.. Negative Regulation of YAP in Response to Retinal Damage
(A) P21 retinal immunofluorescence with an antibody against total YAP and Müller glial cell (MG) nuclear marker SOX9. (B) Labeling with an antibody specific to phosphorylated YAP (pYAP) and MG marker glutamine synthetase (GS). (C and D) Immunofluorescence for MG markers SOX2 (magenta) and GFAP (green) 48 h after intraocular injection of PBS or N-methyl-D-aspartate (NMDA). (E) SOX2/PH3 immunofluorescence 48 h after NMDA injection. (F and G) Time course western blots (F) and quantification (G; normalized to vinculin) of pYAP and YAP after NMDA injection. (H and I) YAP (magenta)/SOX9 (cyan) and pYAP immunofluorescence (green) (H) and quantification (I) 24 h post-NMDA. (J and K) Cell fraction time course western blots (J) and quantification (K) of YAP and pYAP 24 and 48 h post-NMDA. For western blots, levels are given as a.u. ± SEM relative to PBS or no-treatment (NT) controls harvested at the 6-h time point (set to 1) (n = 3 independent pooled samples per group; Student’s t test). For pixel intensity measurements, levels are given as mean ± SEM (n = 3 per group; Wilcoxon rank-sum test). *p ≤ 0.05, **p ≤ 0.01, ***p ≤ 0.001.
Figure 2.
Figure 2.. CYCLIN D3 and Cyclin D1 Expression in Response to Retinal Injury and CKO of Yap and Taz
(A) CYCLIN D1 and CYCLIN D3 western blot time course of NMDA-damaged retinae. (B and C) Quantification of CYCLIN D3 western blots (B) and qRT-PCR (C) analysis of mRNA. (D and E) Quantification of CYCLIN D1 western blots (D) and qRT-PCR (E) analysis of mRNA. (F) CYCLIN D1 immunofluorescence 12, 24, and 48 h post-injury. (G and H) YAP (magenta) and SOX9 (cyan) immunofluorescence on control (G) and CKO MGs (H) (labeled with GFP from the ROSE26R-mTmG Cre reporter). (I and J) CYCLIN D3 (magenta) and SOX9 (cyan) immunofluorescence on control (I) and CKO MGs (J). (K and L) CYCLIN D1 (magenta) and SOX2 (cyan) immunofluorescence on control (K) and CKO MGs (L). For western blots, levels are given as a.u. ± SEM relative to the 6-h post-injection PBS control (set to 1) (n = 3 independent pooled samples per group; Student’s t test). For qRT-PCR, mRNA levels are relative to the no-treatment (NT) control (set to 1) and depicted as fold change ± SEM (n = 3 independent pooled samples per group; Student’s t test). *p ≤ 0.05, **p ≤ 0.01.
Figure 3.
Figure 3.. Genetic Loss or Bypass of Hippo Signaling Results in Spontaneous MG Proliferation
(A–D) EdU labeling (magenta) of Lats1/Lats2 on control (A) and CKO (B, C, and D) retinae. (E and F) EdU labeling (magenta) and immunofluorescence for SOX2 (green) and KI67 (cyan) in CKO (E and F). (F) shows the same nuclei as in (E) (arrowhead). (G) Quantification of EdU+ cells in tamoxifen-injected mice versus corn oil vehicle controls. (H) Map of the Yap5SA transgene. (I and J) EdU labeling (magenta) and SOX9 (green) immunofluorescence on control (I) and YAP5SA-expressing (J) retinae (the boxed nucleus in J is shown in the insets). (K) EdU labeling of radially oriented nuclear clusters. (L) EdU labeling of YAP5SA+ retinae that were also exposed to NMDA damage. (M and N) Flow cytometry (M) and quantification (N) of EdU-labeled, tdTomato+ cells from untreated and NMDA-damaged retinae expressing YAP5SA. (O) CYCLIN D1 immunofluorescence and EdU labeling of YAP5SA+ retinae. (P) Cyclin D1 qRT-PCR from three independent pools of tamoxifen-induced Glast-CreERT2+/tg; Yap5SA+/tg retinae (green bars) compared to tamoxifen-induced Glast-CreERT2+/tg retinae (black bar). For qRT-PCR, mRNA levels are relative to the control (set to 1) and depicted as fold change ± SEM (n = 3 independent pooled samples per group; Student’s t test). *p ≤ 0.05, **p ≤ 0.01, ***p ≤ 0.001.
Figure 4.
Figure 4.. Single-Cell mRNA Sequencing of YAP5SA+ Cells
(A) Approach for unbiased single-cell mRNA sequencing (scRNA-seq) transcriptome analysis of YAP5SA+ MGs. (B) Two-dimensional colored t-SNE representation of 13,511 single-cell transcriptomes. (C) Cell-cycle phase analysis of single tdTomato+ cells. The approximate cell-cycle phase was calculated by scoring individual cells on their expression for S-,G1-, and G2- and/or M-phase transition genes as defined by Kowalczyk et al. (2015). (D–F) Feature plots showing the expression of D-type cyclin genes (D) and known MG (E) and RPC (F) genes projected across t-SNE. Red indicates high gene expression. (G) Dot plot showing significant enrichment of Lhx2 expression within the YAP5SA+ cell cluster compared with the control. The color represents the average expression level, and the size represents the percentage of cells expressing Lhx2. (H) GO-term enrichment of the YAP5SA-4 cluster over the MCG-1 to MGC-3 clusters. (I and J) Feature plots (I) and dot plots (J) showing the presence of a rare population of YAP5SA+ cells that express the neuronal transcripts Elavl2 and Elavl4. (K) HuC/D immunofluorescence confirming the presence of the Elavl2/Elavl4+ cell population (arrowhead and arrows).

References

    1. Azzolin L, Zanconato F, Bresolin S, Forcato M, Basso G, Bicciato S, Cordenonsi M, and Piccolo S (2012). Role of TAZ as mediator of Wnt signaling. Cell 151, 1443–1456. - PubMed
    1. Azzolin L, Panciera T, Soligo S, Enzo E, Bicciato S, Dupont S, Bresolin S, Frasson C, Basso G, Guzzardo V, et al. (2014). YAP/TAZ incorporation in the β-catenin destruction complex orchestrates the Wnt response. Cell 158, 157–170. - PubMed
    1. Barrasso AP, Wang S, Tong X, Christiansen AE, Larina IV, and Poché RA (2018). Live imaging of developing mouse retinal slices. Neural Dev. 13, 23. - PMC - PubMed
    1. Bernardos RL, Barthel LK, Meyers JR, and Raymond PA (2007). Late-stage neuronal progenitors in the retina are radial Müller glia that function as retinal stem cells. J. Neurosci 27, 7028–7040. - PMC - PubMed
    1. Bienvenu F, Jirawatnotai S, Elias JE, Meyer CA, Mizeracka K, Marson A, Frampton GM, Cole MF, Odom DT, Odajima J, et al. (2010). Transcriptional role of Cyclin D1 in development revealed by a genetic-proteomic screen. Nature 463, 374–378. - PMC - PubMed

Publication types

MeSH terms