. 2019 Mar;145(3):1389.
doi: 10.1121/1.5093623.

Simulations of the effect of unlinked cochlear-implant automatic gain control and head movement on interaural level differences

Affiliations

Simulations of the effect of unlinked cochlear-implant automatic gain control and head movement on interaural level differences

Alan W Archer-Boyd et al. J Acoust Soc Am. 2019 Mar.

Abstract

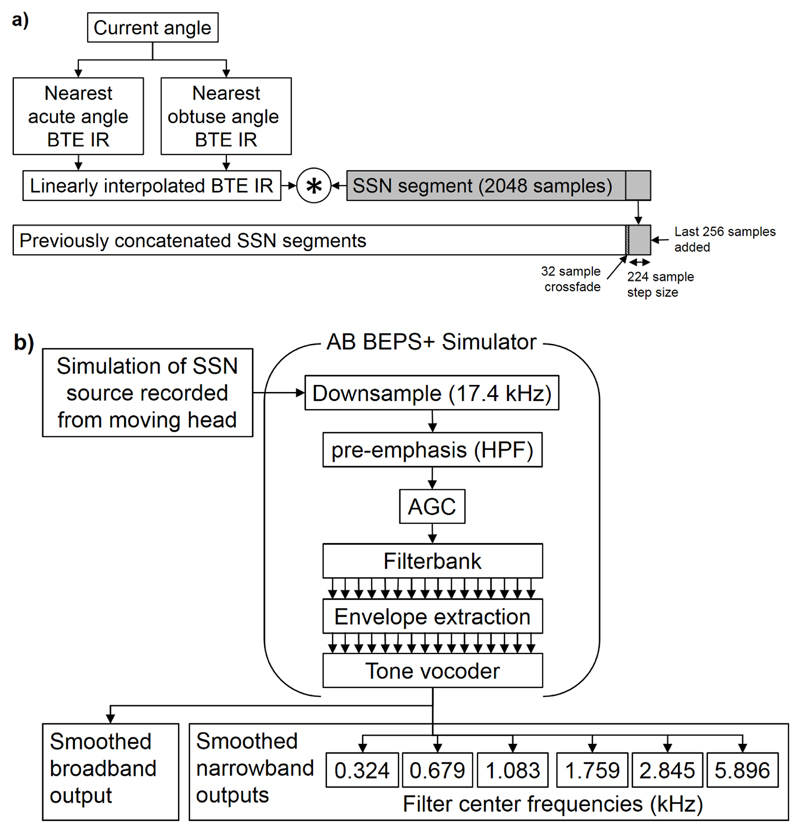
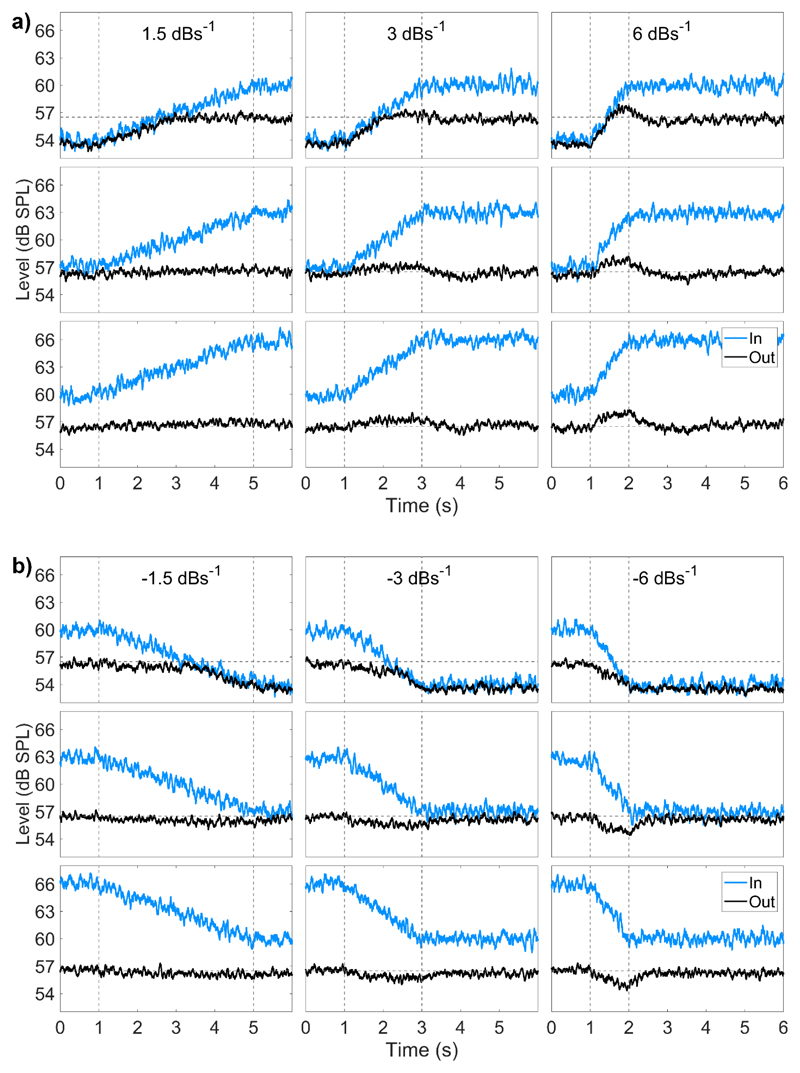
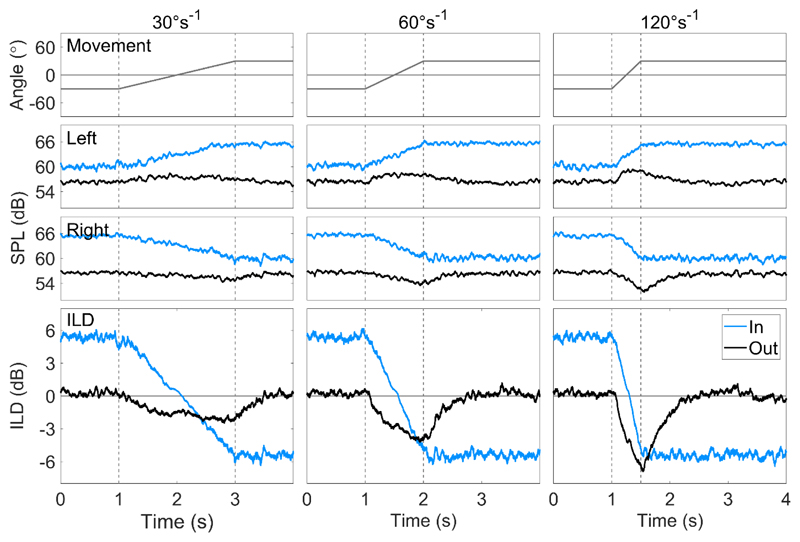
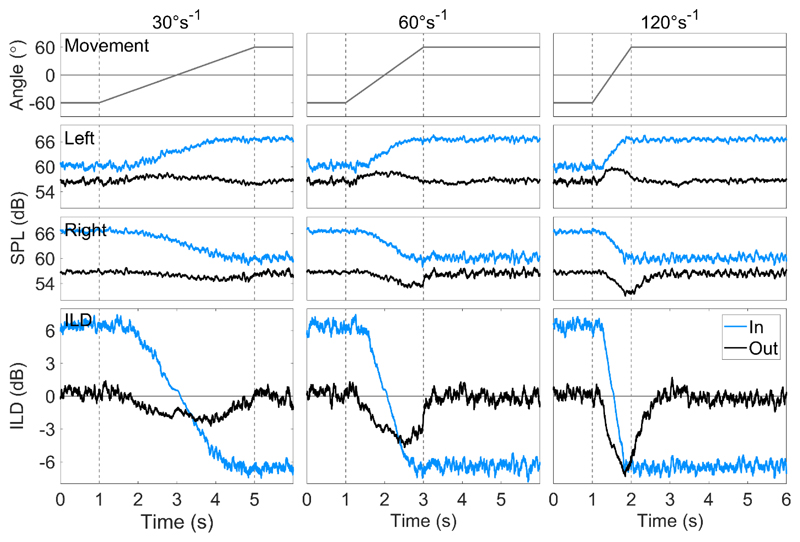
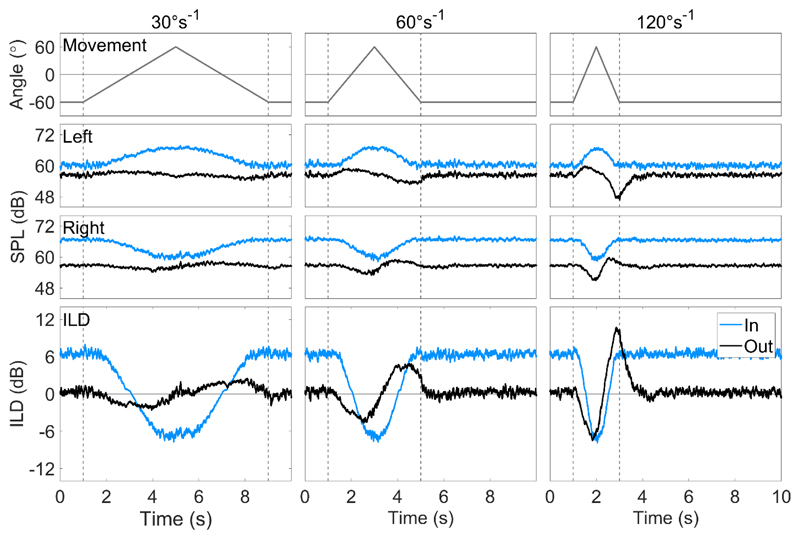
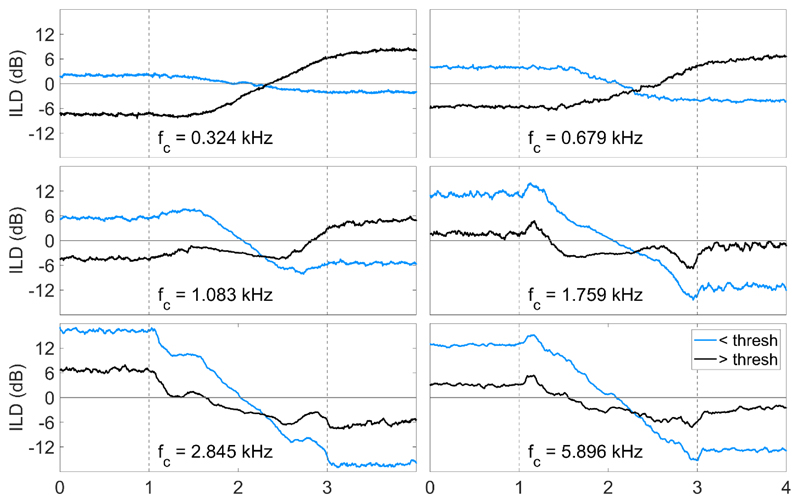
This study simulated the effect of unlinked automatic gain control (AGC) and head movement on the output levels and resulting inter-aural level differences (ILDs) produced by bilateral cochlear implant (CI) processors. The angular extent and velocity of the head movements were varied in order to observe the interaction between unlinked AGC and head movement. Static, broadband input ILDs were greatly reduced by the high-ratio, slow-time-constant AGC used. The size of head-movement-induced dynamic ILDs depended more on the velocity and angular extent of the head movement than on the angular position of the source. The profiles of the dynamic, broadband output ILDs were very different from the dynamic, broadband input ILD profiles. Short-duration, high-velocity head movements resulted in dynamic output ILDs that continued to change after head movement had stopped. Analysis of narrowband, single-channel ILDs showed that static output ILDs were reduced across all frequencies, producing low-frequency ILDs of the opposite sign to the high-frequency ILDs. During head movements, low- and high-frequency ILDs also changed with opposite sign. The results showed that the ILDs presented to bilateral CI listeners during head turns were highly distorted by the interaction of the bilateral, unlinked AGC and the level changes induced by head movement.


Figures

Figure 1
Figure 1
a) Schematic showing the technique used to simulate a static source incident on a moving head and create a bilateral input signal. b) Schematic showing the signal path for the CI simulator and output.
Figure 2
Figure 2
a) Input and output level changes for +6dB input level increase. Each column displays a different increase rate. Column one (left) shows 1.5 dBs-1, column two (middle) 3 dBs-1, and column three (right) 6 dBs-1. Each row shows a different starting level. Row one shows a starting input level of 54 dB SPL, row 2 57 dB SPL, and row 3 60 dB SPL. Input is shown in grey and output in black. The areas of the plots bounded by the dashed lines show the period of rotational movement. b) The same as 2b, for an input level decrease of -6 dB. Row 1 shows a starting level of 60 dB SPL, row 2 63 dB SPL, and row 3 66 dB SPL.
Figure 3
Figure 3
Head movements, left and right input and output levels, and input and output ILDs plots, for a speech-shaped noise input at 60 dB SPL (left ear). Each column displays a different rotational velocity. Column one (left) shows 30°s-1, column two (middle) 60°s-1, and column three (right) 120°s-1. Row one shows head movement, row two shows the input (grey) and output (black) level of the device at the left ear, row three shows the same for the right ear, and row four shows the input (grey) and output (black) ILDs. The areas of the plots bounded by the dashed lines show the period of rotational movement.
Figure 4
Figure 4
As figure 3 for head movements from -60° to 60°.
Figure 5
Figure 5
As figure 3 for head movements from -60° to 60° to -60°.
Figure 6
Figure 6
(color online) Sub- (blue) and supra-threshold (black) ILD plots for 6 channels of a standard map. The input signal was SSN and the head movement was -60° to 60° at 60°s-1, identical to the movement shown in figure 2, middle column. See Table 1 for the bandwidths of each channel. The areas of the plots bounded by the dashed lines show the period of rotational movement.
Figure 7
Figure 7
A schematic of possible perceived source positions at different time points of a -60° to 60° head turn at 60°s-1. The black circles show the actual source position; the dark grey circles show the possible perceived source position based on the broadband ILD (row 1); the graded ovals show the possible perceived source position based on the channel outputs, darker for low frequency, lighter for high frequency (row 2); the light grey circles show the possible perceived source position based on the output of channel 13, a high-frequency channel (row 3). In column A the head is at -60° and about to move; in column B the head is at 0°, halfway through the movement; in column C the head is at 60° at the end of the movement; in column D the head is at 60° >0.5 seconds after movement has stopped.

References

    1. Advanced Bionics. Bionic Ear Programming System Plus. Valencia, CA, USA: 2014.
    1. Advanced Bionics. Soundwave 2.3. Valencia, CA, USA: 2015.
    1. Agterberg M. Hearing with acoustic hearing implants, proposal multicenter study towards treatment options for patients with a contra indication for hearing aids. Journal of Hearing Science. 2018;8
    1. ANSI. ANSI S3.22-2003: Specification of hearing aid characteristics. American National Standards Institute; New York: 2003.
    1. Archer-Boyd AW, Holman JA, Brimijoin WO. The minimum monitoring signal-to-noise ratio for off-axis signals and its implications for directional hearing aids. Hear Res. 2018;357:64–72. - PMC - PubMed

Publication types