. 2019 Jul;9(7):962-979.
doi: 10.1158/2159-8290.CD-18-1391. Epub 2019 May 8.

A Gain-of-Function p53-Mutant Oncogene Promotes Cell Fate Plasticity and Myeloid Leukemia through the Pluripotency Factor FOXH1

Affiliations

A Gain-of-Function p53-Mutant Oncogene Promotes Cell Fate Plasticity and Myeloid Leukemia through the Pluripotency Factor FOXH1

Evangelia Loizou et al. Cancer Discov. 2019 Jul.

Abstract

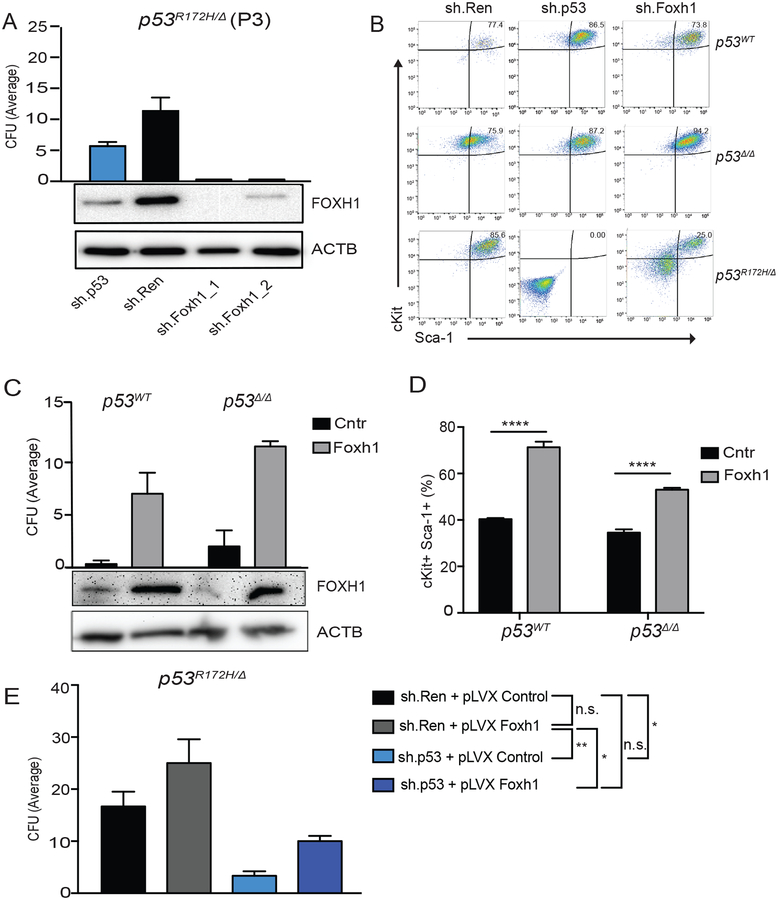
Mutations in the TP53 tumor suppressor gene are common in many cancer types, including the acute myeloid leukemia (AML) subtype known as complex karyotype AML (CK-AML). Here, we identify a gain-of-function (GOF) Trp53 mutation that accelerates CK-AML initiation beyond p53 loss and, surprisingly, is required for disease maintenance. The Trp53R172H mutation (TP53R175H in humans) exhibits a neomorphic function by promoting aberrant self-renewal in leukemic cells, a phenotype that is present in hematopoietic stem and progenitor cells (HSPC) even prior to their transformation. We identify FOXH1 as a critical mediator of mutant p53 function that binds to and regulates stem cell-associated genes and transcriptional programs. Our results identify a context where mutant p53 acts as a bona fide oncogene that contributes to the pathogenesis of CK-AML and suggests a common biological theme for TP53 GOF in cancer. SIGNIFICANCE: Our study demonstrates how a GOF p53 mutant can hijack an embryonic transcription factor to promote aberrant self-renewal. In this context, mutant Trp53 functions as an oncogene to both initiate and sustain myeloid leukemia and suggests a potential convergent activity of mutant Trp53 across cancer types.This article is highlighted in the In This Issue feature, p. 813.


Conflict of interest statement

S.W.L. is a founder and member of the scientific advisory board of Mirimus, Inc., Blueprint Medicines, and ORIC Pharmaceuticals; he is also on the scientific advisory board of Constellation Pharmaceuticals and PMV Pharmaceuticals. All of the other authors declare no conflicts of interest.

Figures

Figure 1.
Figure 1.. p53R172H Leads to Accelerated Onset of Hematological Malignancies.
(A) Kaplan-Meier survival curves of native mice with p53Δ/Δ and p53R172H/Δ hematopoietic cells recombined using Vav1-Cre. (B) Spectrum of hematological malignancies arising in p53Δ/Δ (n=15) and p53R172H/Δ (n=11 native mice. (C) Kaplan-Meier survival curves of thymectomized mice transplanted with p53f/f, p53f/f;Mx1-Cre and p53R172H/F;Mx1-Cre bone marrow (BM) (D) Expression of CD11b and Gr1 in the peripheral blood of moribund mice from (C) (E) Representative H&E image of mice with acute myeloid leukemia arising after transplant in thymectomized recipients. ** p <0.005, **** p <0.0001, Log-rank (Mantel-Cox) test.
Figure 2.
Figure 2.. Depletion of mutant p53 impairs the growth of p53 mutant leukemias.
(A) The ratio of sh.p53 BFP+ cells compared to sh.Ren BFP+ cells over time in leukemic lines. (B) CD11b expression in the shRNA BFP+ containing cells (n = 3) and (C) Annexin V shown by FACS 7 days after infection. Data presented as mean ± s.e.m (D) Relative expression of TP53 7 days post infection with pRS sh.TP53 in human KY821 cells. (E) CFU in human AML cells with sh.Ren or sh.TP53. Data presented as mean ± s.e.m (n = 3) (F) hCD16 expression by FACS in pRS Ctrl or pRS TP53 cells from growing in CFU assay (G) Percentage of hCD45 in the peripheral blood of mice 5 weeks post transplant in shCntr and shCntr moribund mice (black), shTP53 (blue) and shTP53 moribund mice (orange). Data are represented as mean ± s.e.m (n=5 and n=5) (H) Kaplan-Meier curve from NSG mice transplanted with equal numbers of KY821 cells transduced with wither shCntr or shTP53 (n=5 and n=5). (I) Western blot for human TP53 in cells before injection and in sorted hCD45 cells from the peripheral blood of 3 independent moribund shTP53 mice. *p <0.05, **p <0.005 ***p <0.0005. B. Kruskal-Wallis 1-way ANOVA. C, D, F, J, unpaired t-test.
Figure 3.
Figure 3.. Gene expression profile of p53R172H/Δ leukemias.
(A) Volcano plot from RNA-seq comparing p53R172H/Δ leukemias to p53Δ/Δ showing p53 as the most highly expressed gene between the two groups. (B) Gene ontology analysis of pathways associated with genes up-regulated in p53R172H/Δ leukemias. (C) Expression of Gene Ontology-associated pathways in human AML samples and normal human hematopoietic cells (www.bloodspot.eu). (D) Gene Set Enrichment Analysis (GSEA) comparing gene expression between p53R172H/Δ leukemias to p53Δ/Δ and other known signatures related to stem cells and hematopoietic stem cells. Two-tailed t-test * p <0.05, ** p <0.005, *** p <0.0005. HSC: Hematopoietic stem cell, MPP: Multipotential progenitors, CMP: Common myeloid progenitor cell, GMP: Granulocyte monocyte progenitors, MEP: Megakaryocyte-erythroid progenitor cell, early_PM: Early Promyelocyte, late_PM: Late Promyelocyte, MY: Myelocyte, MM: Metamyelocytes, BC: Band cell, PMN: Polymorphonuclear cells, Mono: Monocytes.
Figure 4.
Figure 4.. p53R172H induces aberrant self-renewal in vitro and in vivo.
(A) Total number of colony-forming units (CFU) generated by p53WT (black), p53Δ/Δ (red) and p53R172H/Δ (blue) cells. Data are representative from four independent experiments. Error bars correspond to mean ± s.e.m (n=3). (B) Total number of colony-forming units (CFU) generated by p53R172H/Δ cKIT+ cells containing sh.Ren or sh.p53. Data are representative from three independent experiments. Error bars correspond to mean ± s.e.m (n=3). (C) Western-blotting for TP53 and B-ACTIN at passage 4 (P4). (D) Schematic representation of the competitive transplantation protocol. (E) Percentage of CD45.2 cells during the secondary competitive transplant in the PB of mice monitored monthly by bleeding (n=5 per group). (F) Percentage of CD45.2 cells in the PB four months after transplant (n=4–7). (G) Percentage of CD45.2 cells in the BM four months after transplant (n=4–7), (H) Percentage of Megakaryocyte Erythrocyte Progenitors (MEP), (I) Granulocyte Monocyte Progenitors (GMP) and (J) Common Myeloid Progenitors (CMP) in the BM of mice four months after transplant (n=4–7). (K) Schematic representation of the transplant layout. LSKs were sorted from p53R172H/Δ mice and were infected with an sh.Ren or sh.p53 conjugated to BFP fluorescence. Two days after infection equal numbers of cells were transplanted in lethally irradiated CD45.1 mice. (L) BFP fluorescence over time as assessed by monthly bleeds in recipient mice (n=5). (M) Percentage of BFP+ cells in the BM of mice with sh.Ren or sh.p53 four months after transplant (n=3–5). (N) Percentage of BFP+ LSKs in the BM of mice with sh.Ren or sh.p53 four months after transplant (n=3–5). B, C, and D. Two-tailed t-test * p <0.05, ** p <0.005, *** p <0.0005. Error bars correspond to mean ± s.e.m.
Figure 5.
Figure 5.. Identification of Foxh1 as a p53 mutant mediator.
(A) GSEA comparing the expression of genes associated with genomic regions occupied by Foxh1 when compared to the genes differentially expressed in p53R172H and p53Δ/Δ leukemias. (B) Microarray data showing the expression of FoxH1 across normal human hematopoietic cells and different types of leukemias. (C) Overall Survival in patients with AML that have FoxH1 mRNA upregulation or genetic amplification compared to patients without (cbioportal –TCGA). (D) Western-blotting for FOXH1 in HSPCs from p53R172H and p53Δ/Δ cells at Passage 4. (E) Western-Blotting for TP53 and FOXH1 in p53R172H HSPCs transduced with sh.Ren or sh.p53. (F) Western-Blotting for TP53 and FOXH1 in two independent p53R172H murine leukemic cells transduced with sh.Ren or sh.p53. (G) Western-Blotting for TP53 and FOXH1 in p53R175H human leukemic cells transduced with sh.Ren or sh.TP53. * p <0.05, ** p <0.005, *** p <0.0005. Hematopoietic stem cell, MPP: Multipotential progenitors, CMP: Common myeloid progenitor cell, GMP: Granulocyte monocyte progenitors, MEP: Megakaryocyte-erythroid progenitor cell, early_PM: Early Promyelocyte, late_PM: Late Promyelocyte, MY: Myelocyte, MM: Metamyelocytes, BC: Band cell, PMN: Polymorphonuclear cells, Mono: Monocytes.
Figure 6.
Figure 6.. Foxh1 directly binds genes involved in leukemia and stem cell properties.
(A) Pie charts depicting the genome-wide distribution of Foxh1 binding in murine leukemic cells. (B) Motif enrichment analysis for the Foxh1 bound genomic regions in leukemic cells. (C) Gene ontology analysis of genes bound by Foxh1 in murine leukemic cells (D) Venn Diagram depicting the overlap between the genes down regulated upon p53 KD (blue circle, Foxh1 KD (green circle) and Foxh1 ChIP (orange circle). (E) GSEA from transcriptional profile of cells upon Foxh1 KD. (F) Gene tracks for Foxh1 ChIP-seq at the Runx2 and Mef2c loci together with RNA-seq tracks from either sh.Ren (Red), sh. Foxh1 (green) or sh.p53 (blue). (G) Mean log2 expression of transcriptional signature composed of significantly up-regulated genes in p53R172H/Δ versus p53Δ/Δ murine leukemias across AML and normal cells, as well as (H) same comparison for genes downregulated following Foxh1 KD. Student’s t-test between CK- AML and other AML types: * p <0.05, ** p <0.005, *** p <0.0005, **** p <0.00005..
Figure 7.
Figure 7.. Foxh1 is necessary and sufficient for the enhanced self-renewal phenotype produced by mutant p53.
(A) Total number of colony-forming units (CFU) generated by p53R172H/Δ HSPCs containing sh.p53 (blue), sh.Ren (black), shFoxH1.1072 (1) (plum), shFoxH1.1116 (2) (maroon). Data are representative of three experiments. Error bars correspond to mean ± s.e.m (n=3). Lower panels: Western-blotting intensities for FOXH1 for the different conditions. (B) cKit+ and Sca-1+ expression analyzed by FACS in sh.Ren, sh.p53 and sh.FoxH1 containing HSPCs from p53WT, p53Δ/Δ and p53R172H/Δ mice. Data are representative of three experiments. (C) Total number of colony-forming units (CFU) generated by p53Δ/Δ and p53WT HSPCs containing pLVX Control (black) or pLVX Foxh1 cDNA (grey). Data are representative of three experiments. Error bars correspond to mean ± s.e.m (n=3). Lower panel: Western-blotting for FOXH1 for the different conditions. (D) Percentage of cKit+Sca-1+ HSPCs analyzed by FACS in p53Δ/Δ and p53WT cells containing pLVX Control or pLVX Foxh1 cDNA. Data are representative of three experiments. Error bars correspond to mean ± s.e.m (n=3). (E) Total number of colony-forming units (CFU) generated by p53R172H/Δ HSPCs containing sh.Ren + pLVX Control (black), sh.Ren + pLVX Foxh1 cDNA (grey), sh.p53 + pLVX Control (light blue), sh.p53 + pLVX Foxh1 cDNA (dark blue). Data are representative of three experiments. Error bars correspond to mean ± s.e.m (n=3) * p <0.05, ** p <0.005, *** p <0.0005.

References

    1. Kandoth C, McLellan MD, Vandin F, Ye K, Niu B, Lu C, et al. Mutational landscape and significance across 12 major cancer types. Nature 2013;502(7471):333–9 doi 10.1038/nature12634. - DOI - PMC - PubMed
    1. Olivier M, Hollstein M, Hainaut P. TP53 mutations in human cancers: origins, consequences, and clinical use. Cold Spring Harb Perspect Biol 2010;2(1):a001008 doi 10.1101/cshperspect.a001008. - DOI - PMC - PubMed
    1. Laptenko O, Prives C. Transcriptional regulation by p53: one protein, many possibilities. Cell Death Differ 2006;13(6):951–61 doi 10.1038/sj.cdd.4401916. - DOI - PubMed
    1. Serrano M, Lin AW, McCurrach ME, Beach D, Lowe SW. Oncogenic ras provokes premature cell senescence associated with accumulation of p53 and p16INK4a. Cell 1997;88(5):593–602. - PubMed
    1. Lowe SW, Ruley HE, Jacks T, Housman DE. p53-dependent apoptosis modulates the cytotoxicity of anticancer agents. Cell 1993;74(6):957–67. - PubMed

Publication types

MeSH terms

Substances