. 2019 Jun 3;218(6):1871-1890.
doi: 10.1083/jcb.201702187. Epub 2019 May 8.

Deacetylation of Miro1 by HDAC6 blocks mitochondrial transport and mediates axon growth inhibition

Affiliations

Deacetylation of Miro1 by HDAC6 blocks mitochondrial transport and mediates axon growth inhibition

Ashley L Kalinski et al. J Cell Biol. .

Abstract

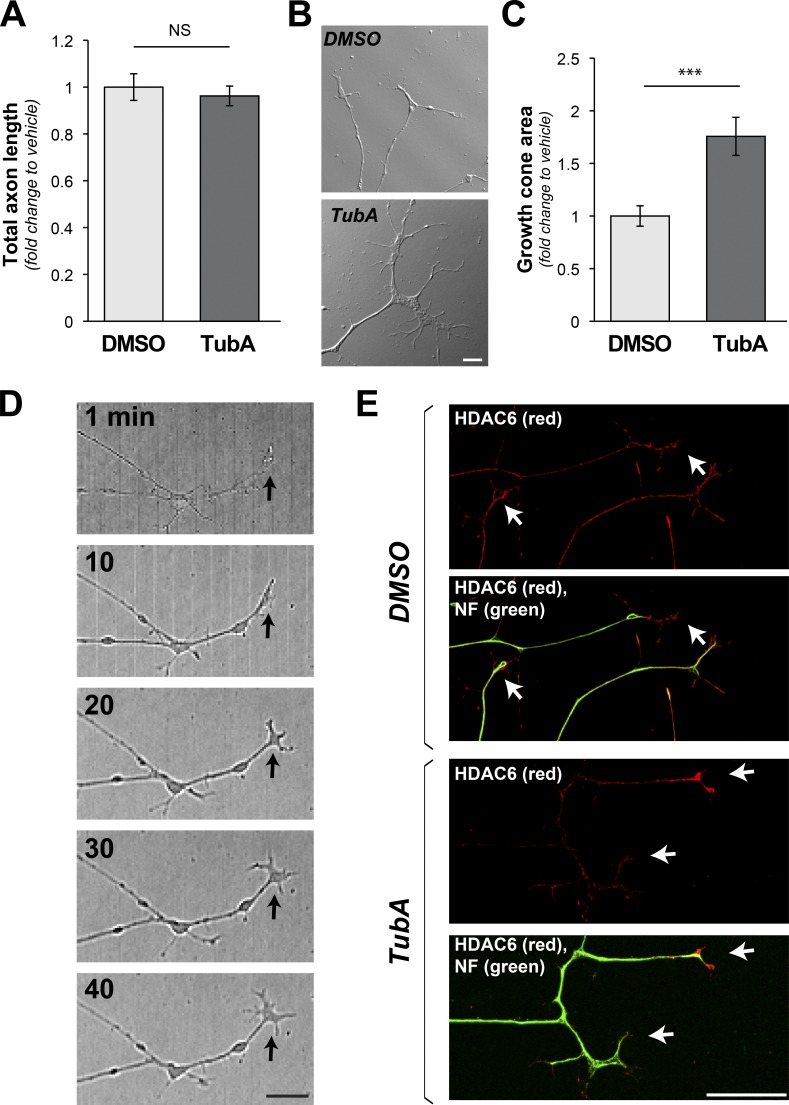
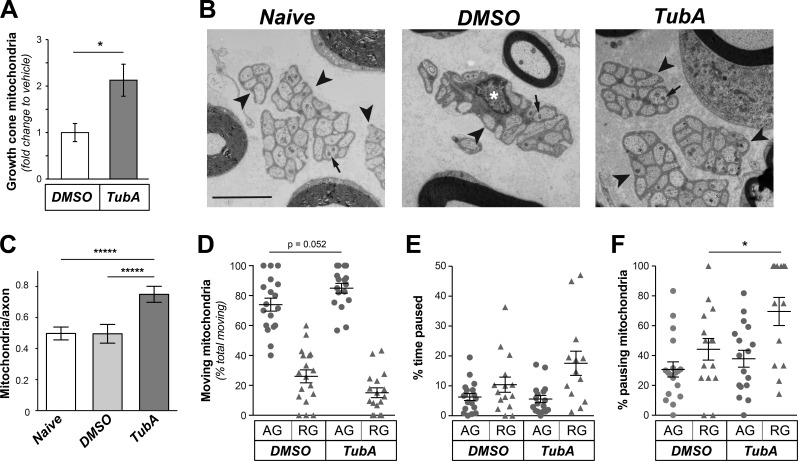
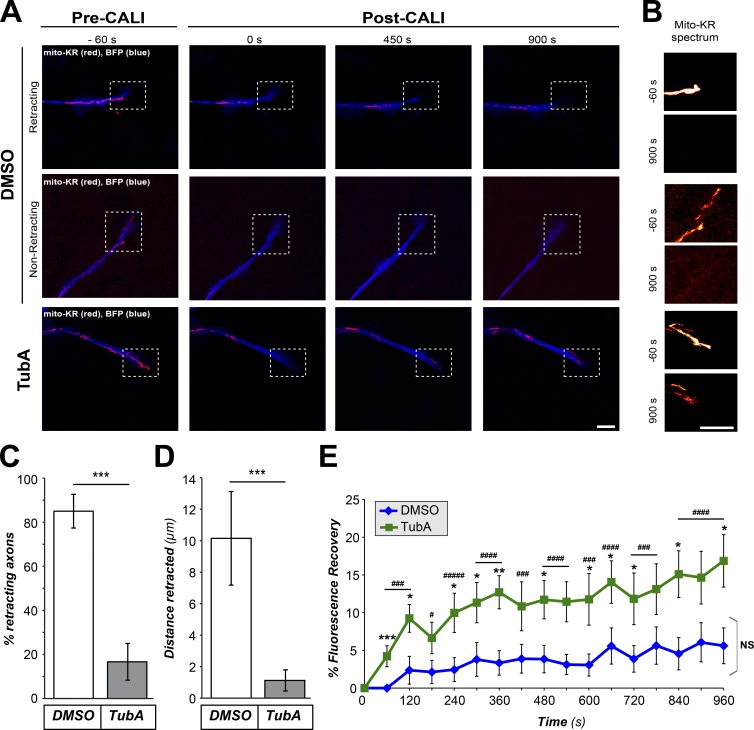
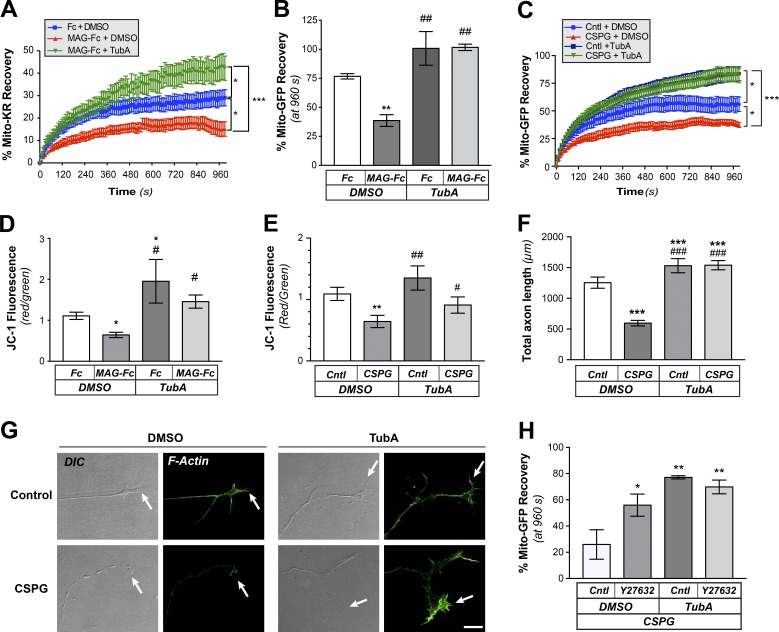
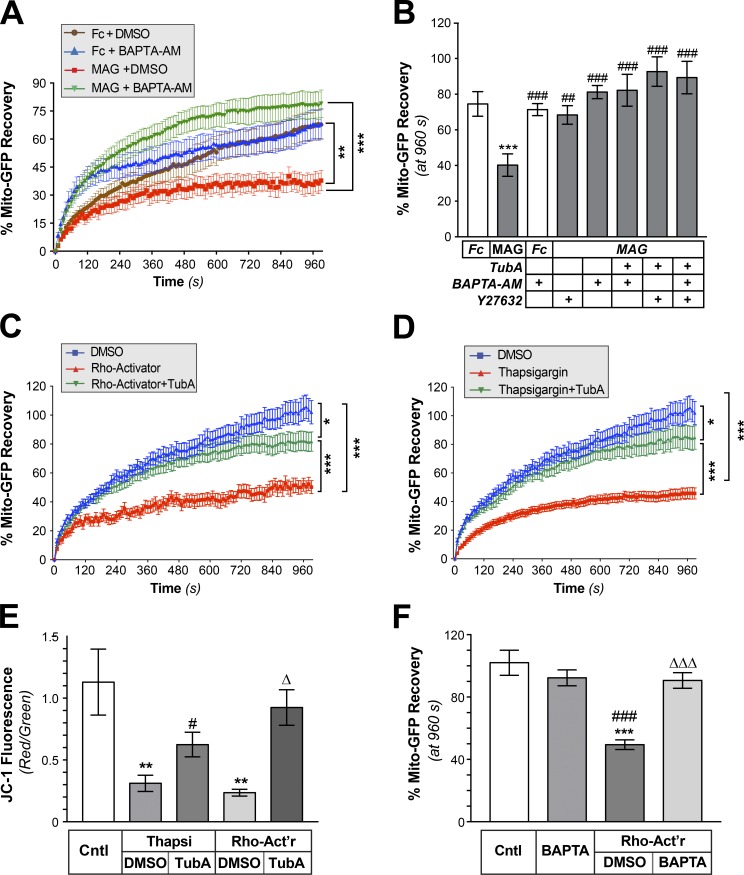
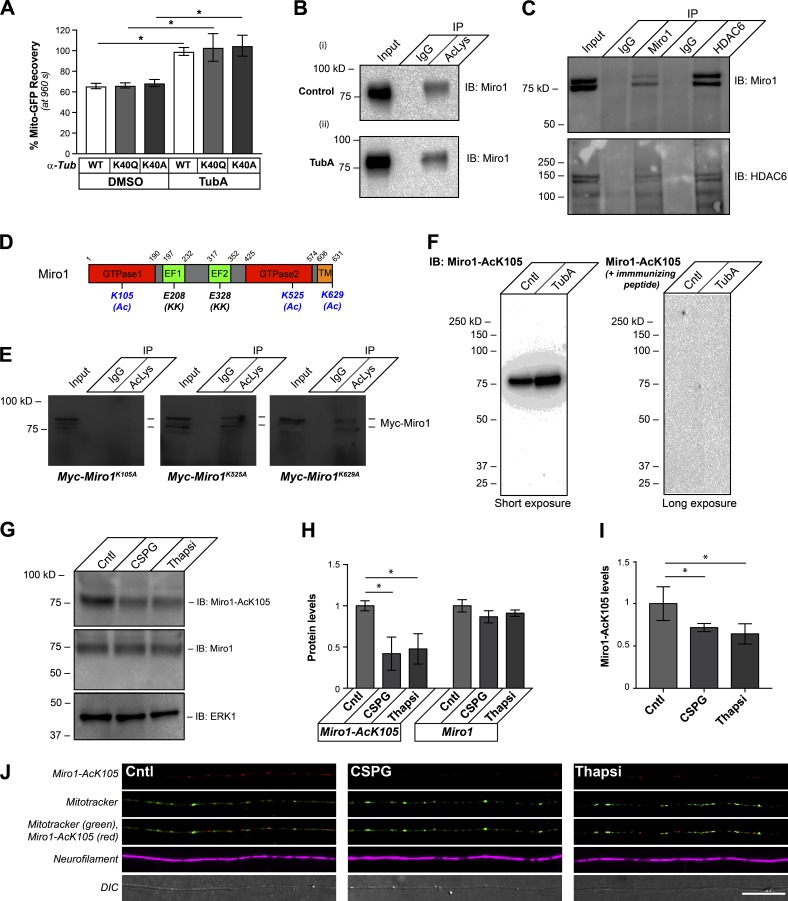
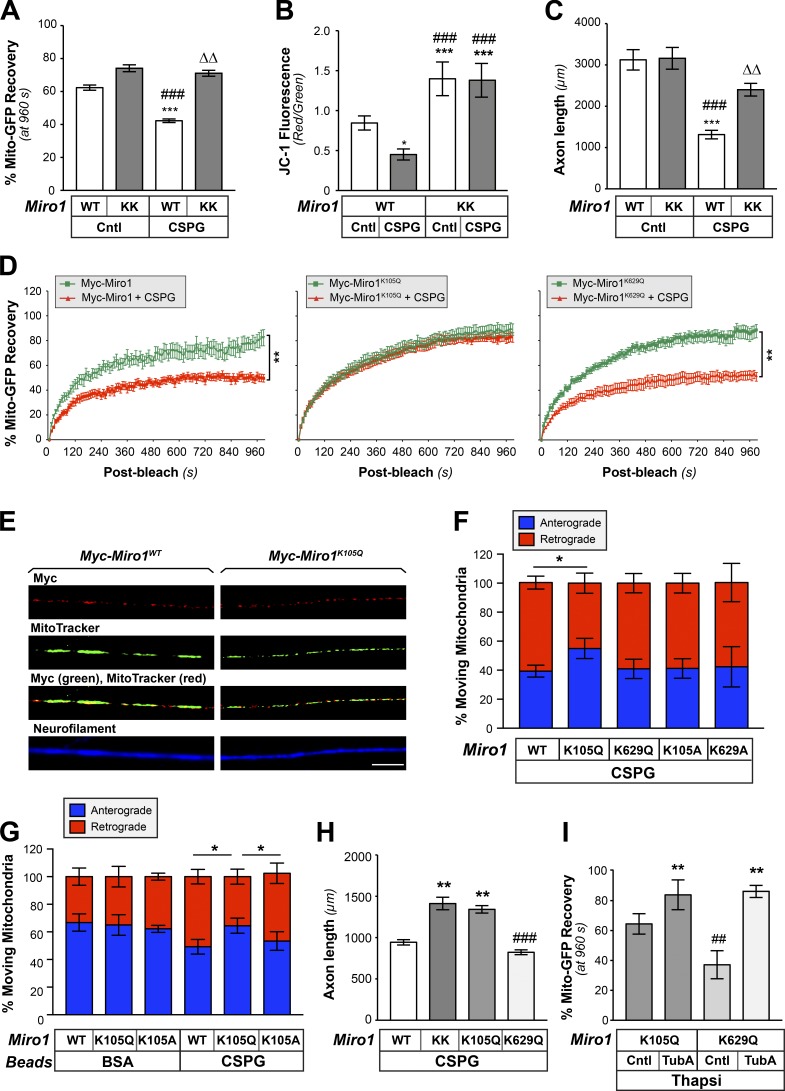
Inhibition of histone deacetylase 6 (HDAC6) was shown to support axon growth on the nonpermissive substrates myelin-associated glycoprotein (MAG) and chondroitin sulfate proteoglycans (CSPGs). Though HDAC6 deacetylates α-tubulin, we find that another HDAC6 substrate contributes to this axon growth failure. HDAC6 is known to impact transport of mitochondria, and we show that mitochondria accumulate in distal axons after HDAC6 inhibition. Miro and Milton proteins link mitochondria to motor proteins for axon transport. Exposing neurons to MAG and CSPGs decreases acetylation of Miro1 on Lysine 105 (K105) and decreases axonal mitochondrial transport. HDAC6 inhibition increases acetylated Miro1 in axons, and acetyl-mimetic Miro1 K105Q prevents CSPG-dependent decreases in mitochondrial transport and axon growth. MAG- and CSPG-dependent deacetylation of Miro1 requires RhoA/ROCK activation and downstream intracellular Ca2+ increase, and Miro1 K105Q prevents the decrease in axonal mitochondria seen with activated RhoA and elevated Ca2+ These data point to HDAC6-dependent deacetylation of Miro1 as a mediator of axon growth inhibition through decreased mitochondrial transport.


Figures

Figure 1.
Figure 1.
Growth cones expand on inhibition of HDAC6. (A) Quantification of neurite length for dissociated DRGs cultured on laminin with addition of HDAC6 inhibitor TubA (10 µm) versus vehicle control (DMSO) over 1 h is shown as average fold-change relative to vehicle ± SEM (n ≥ 95 neurons across three independent experiments; NS by one-way ANOVA with Bonferroni post hoc). (B and C) Representative DIC images of distal axons from DRG neurons cultured as in A are shown (B). 1-h TubA treatment appears to increase growth cone size. Analyses of growth cone area across multiple experiments show a significant increase in area after TubA treatment (C). Values are average fold-change ± SEM (n ≥ 26 neurons over at least three culture preparations; ***, P ≤ 0.005 by one-way ANOVA with Bonferroni post hoc; scale bar = 5 µm; 40×/1.3 NA objective used). (D) Representative time-lapse image sequence in DIC for a single axon from larger tiled images after addition of TubA as in A. Arrows indicate growth cone position (scale bar = 10 µm). (E) Representative epifluorescent images for HDAC6 (red, Cy5) and NF (green, Cy3) immunoreactivity. Prominent HDAC6 signals are seen in distal axons and growth cones (arrows) regardless of TubA exposure. Axonal localization of transfected HDAC6 protein is shown in Fig. S1 A (scale bar = 10 µm; 40×/1.3 NA objective used).
Figure 2.
Figure 2.
Inhibition of HDAC6 alters axonal mitochondrial transport both in vitro and in vivo. (A) Number of mitochondria in growth cones after exposing DRG cultures to 10 µM TubA versus vehicle (control) for 1 h is shown as average fold-change in number of mitochondria per growth cone ± SEM (n = 13 axons across three culture preparations; *, P ≤ 0.05 by one-way ANOVA with Bonferroni post hoc analysis). See Fig. S3 (A–E) for kinetics of mitochondria movement in axons. (B) Representative EMs of Remak bundles (arrowheads) in naive Sciatic nerve and nerves after 2 h vehicle (DMSO) or TubA injection are shown. Arrows indicate mitochondria in the unmyelinated axons. Note that a Schwann cell nucleus (asterisk) is seen in the Remak bundle for DMSO image but not the other two micrographs (scale bar = 3 µm). (C) Quantification of number of mitochondria per unmyelinated axon from EM images as in B is shown as average ± SEM (n ≥ 5; *****, P ≤ 0.0001 by one-way ANOVA with Bonferroni post hoc analysis). (D–F) Quantification for indicated parameters for mitochondrial transport in sciatic nerve in vivo using tetramethylrhodamine, ethyl ester, perchlorate to visualize mitochondria is shown. The percentage pausing mitochondria is significantly different for retrogradely tracked mitochondria in DMSO versus TubA injected nerves (n ≥ 13 axons tracked over four animals; *, P ≤ 0.05 and as indicated by ANOVA with Holm-Sidak’s multiple comparisons test).
Figure 3.
Figure 3.
HDAC6-inhibited growth cones are protected from collapse after mitochondrial ablation. (A and B) Representative images from CALI time-lapse sequence are shown for DRGs cultured on laminin and treated with vehicle control (DMSO) versus 10 µM TubA for 1 h (A). BFP is shown in blue as an axonal marker and Mito-KR signal is shown in red. Boxed regions represent ROI for distal axon and growth cone that was subjected to photoactivation of Mito-KR to ablate mitochondria. (B) Magnified view of ROI with Mito-KR signal as indicated spectral intensity for −60-s and +900-s panels from time lapse. Fig. S4 (A and B) shows that axons analyzed across the DMSO- and TubA-treated cultures had no significant differences in growth cone area or Mito-KR signal intensity before CALI sequence. Images were equivalently adjusted for brightness and contrast before cropping using ImageJ (scale bars = 10 µm for main panels, 2 µm for insets; 63×/1.4 NA objective used). (C and D) Quantifications of percentage of axons retracting (C) and retraction distance (D) from image sequences as in A are shown as average ± SEM (n ≥ 13 across three culture preparations; ***, P ≤ 0.005 by one-way ANOVA with Bonferroni post hoc analysis). (E) Recovery of Mito-KR red fluorescence in photoactivated ROI from image sequences as in A is shown as average of normalized percentage recovery ± SEM (n ≥ 13 axons from three independent experiments; *, P ≤ 0.05; **, P ≤ 0.01; ***, P ≤ 0.005 vs. t = 0; ###, P ≤ 0.005; ####, P ≤ 0.001; #####, P ≤ 0.0005 for TubA vs. control; and NS vs. t = 0 s by one-way ANOVA with Bonferroni post hoc analysis).
Figure 4.
Figure 4.
MAG and CSPGs decrease mitochondrial transport through an HDAC6-dependent pathway. (A) Recovery of Mito-KR signals after CALI to ablate mitochondria in distal axons of DRGs cultured on laminin and exposed to vehicle control (DMSO) or to bath-applied Fc + DMSO, MAG-Fc + DMSO or MAG-Fc + 10 µm TubA. Values represent average of normalized percentage recovery ± SEM (n ≥ 16 axons over five culture preparations; *, P ≤ 0.05; ***, P ≤ 0.005 for indicated treatments by two-way ANOVA with Tukey post hoc). Fc + DMSO was not significantly different than vehicle control (not depicted). (B) End-point FRAP analysis for Mito-GFP in distal axons of DRGs cultured on laminin and treated bath-applied Fc vs. MAG-Fc as in A is shown as average of normalized percentage recovery ± SEM at 960 s after bleach (n ≥ 12 axons over four culture preparations; **, P ≤ 0.05 vs. Fc-control; ##, P ≤ 0.01 vs. MAG + vehicle by two-way ANOVA with Tukey post hoc). Fig. S5 A shows full analysis of the FRAP sequences. (C) FRAP analysis for Mito-GFP recovery in distal axons of DRGs cultured on laminin and treated with ±10 µg/ml bath-applied aggrecan (Cntl or CSPG) and 10 µM TubA or vehicle control (DMSO) is shown as average of normalized percentage recovery ± SEM at 960 s after bleach (n ≥ 16 axons over four culture preparations; *, P ≤ 0.05 for control + DMSO vs. control + TubA and control + DMSO vs. CSPG + DMSO; ***, P ≤ 0.005 for CSPG + DMSO vs. CSPG + TubA and CSPG + DMSO vs. control + TubA by two-way ANOVA with Tukey post hoc). (D and E) Mitochondrial membrane potential was assessed in axon shafts of DRGs cultured on laminin and then treated with bath-applied MAG-Fc (D) or aggrecan (CSPG; E) as in A and C. Values indicate average ratio of normalized red/green fluorescence signals ± SEM within the ROIs after indicated treatments (n ≥ 25 axons over four culture preparations; *, P ≤ 0.05; **, P ≤ 0.01 vs. DMSO; #, P ≤ 0.05; ##, P ≤ 0.01 vs. MAG + DMSO or CSPG + DMSO by two-way ANOVA with Tukey post hoc). (F) Quantitation of axon growth for DRGs cultured on laminin (Cntl) or substrate-bound aggrecan (CSPG) and treated with DMSO or 10 µM TubA. Axon growth was assessed at 24 h and is shown as average total length/neuron ± SEM (n ≥ 95 each over three DRG cultures; ***, P ≤ 0.005 vs. control; ###, P ≤ 0.005 vs. CSPG + vehicle by two-way ANOVA with Tukey post hoc). (G) Representative DIC and F-actin (green, Alexa Fluor 555) images of distal axons from DRGs cultured on laminin and treated with 10 µM TubA or vehicle control (DMSO) are shown before and after bath-applied 10 µg/ml aggrecan (CSPG). Arrows mark axon termini. Images were cropped from larger panels to highlight growth cones using ImageJ (scale bar = 10 µm; 63×/1.4 NA objective used). (H) End-point FRAP analyses for Mito-GFP in distal axons of DRGs cultured on laminin and treated with bath-applied 10 µg/ml aggrecan are shown as average of normalized percentage recovery ± SEM at 960 s after bleach. To test for effects of ROCK inhibition, neurons were pretreated with vehicle (Cntl) or 10 µM Y27632. To test for potential synergism with HDAC6 inhibition, control and Y27632-treated cultures were exposed to DMSO or 10 µM TubA (n ≥ 16 axons over four culture preparations; *, P ≤ 0.05; **, P ≤ 0.005 for indicated treatments by two-way ANOVA with Tukey post hoc).
Figure 5.
Figure 5.
RhoA/ROCK pathway activates HDAC6 through a Ca2+-dependent mechanism. (A) FRAP analyses for Mito-GFP in distal axons of DRGs cultured on laminin and treated with bath-applied Fc + DMSO, Fc + 3 µM BAPTA-AM, MAG-Fc + DMSO, or MAG-Fc + 3 µM BAPTA-AM are shown as average normalized percentage recovery ± SEM (n ≥ 9 axons over three culture preparations; **, P ≤ 0.01; ***, P ≤ 0.005 for indicated treatments by two-way ANOVA with Tukey post hoc). BAPTA-AM is not statistically different from over 300 to 960 s. (B) End-point FRAP for Mito-GFP in distal axons of DRGs treated with bath-applied Fc vs. MAG-Fc ± 3 µM BAPTA-AM, 10 µM Y27632, 10 µM TubA, or indicated combinations of these inhibitors is shown as average of normalized percentage recovery ± SEM at 960 s after bleach (n ≥ 9 axons over three culture preparations; ***, P ≤ 0.005 vs. Fc; ##, P ≤ 0.01; ###, P ≤ 0.005 vs. Mag-treated by two-way ANOVA with Tukey post hoc). BAPTA-AM is not statistically different from vehicle. (C and D) FRAP for Mito-GFP in distal axons of DRGs treated with RhoA Activator (C) or Thapsigargin (D) is shown as average normalized percentage recovery ± SEM. Data for vehicle control (DMSO), 1 µg/ml of Rho-Activator (+ DMSO), Rho-Activator + 10 µM TubA, 1 µM Thapsigargin (+ DMSO), and Thapsigargin + 10 µM TubA are shown (n ≥ 9 axons over three culture preparations; *, P ≤ 0.05; ***, P ≤ 0.005 for indicated treatments by two-way ANOVA with Tukey post hoc). (E) Quantification of mitochondrial membrane potential based on red/green fluorescence of JC-1 in axon shafts of DRGs cultured on laminin (Cntl) or aggrecan (CSPG) substrates is shown after treatment with 1 µM Thapsigargin (Thapsi), Thapsi + 10 µM TubA, 1 µg/ml Rho-Activator (Rho-Act’r), or Rho-Act’r + TubA. Values represent average ratio of normalized red/green fluorescent JC-1 signals ± SEM (n ≥ 20 axons over three culture preparations; **, P ≤ 0.01 vs. control; #, P ≤ 0.05 vs. Thapsi + DMSO; Δ, P ≤ 0.01 vs. Rho-Act’r + DMSO by two-way ANOVA with Tukey post hoc). (F) End-point FRAP for Mito-GFP in distal axons of DRGs cultured on laminin and treated ± 3 µM BAPTA-AM, 1 µg/ml Rho-Act’r, Rho-Act’r + BAPTA-AM is shown as average of normalized percentage recovery ± SEM at 960 s after bleach (n ≥ 9 axons over three culture preparations; ***, P ≤ 0.005 vs. control; ###, P ≤ 0.005 vs. BAPTA-AM; ΔΔΔ, P ≤ 0.005 vs. Rho-Act’r + DMSO by two-way ANOVA with Tukey post hoc). BAPTA-AM is not statistically different from control.
Figure 6.
Figure 6.
Miro1 K105Q is an axonal substrate for HDAC6 after exposure to CNS growth inhibitors. (A) End-point FRAP for Mito-GFP recovery in distal axons of DRGs transfected with WT, acetyl-mimetic (K40Q), or nonacetylatable (K40A) α-tubulin constructs and plated onto laminin is shown as average of normalized percentage recovery ± SEM at 960 s after bleach. Exposure to 10 µM TubA significantly increases Mito-GFP recovery in all three conditions (*, P ≤ 0.05 for TubA-treated vs. its corresponding DMSO control by two-way ANOVA with Tukey post hoc). Fig. S6 (A and B) shows that these mutant α-tubulin proteins are incorporated into axonal microtubules and expressed at relatively equivalent levels. (B) Representative immunoblot is shown for Miro1 from input and immunoprecipitations with magnetic bead-conjugated nonimmune IgGs or anti–Ac-Lys antibody cocktail from DRG neurons treated with 10 µM TubA for 4 h. 10% of the protein lysate was used as input (pull-down efficiency of 10.1 ± 1.9% for control vs. 14.1 ± 2.2% for TubA over n = 4; P = 0.012 by two-tailed Student’s t test). (C) HDAC6 is detected in Miro1 immunoprecipitates, and Miro1 is detected in HDAC6 immunoprecipitates from cultured DRG neurons by immunoblotting. 10% of the protein lysate was used as input. (D) Schematic of rat Miro1 sequence with residues previously reported to be acetylated in nonneuronal cells indicated (K105, K525, and K629 plus (Ac)). The glutamate-to-lysine mutations that were previously reported to decrease Miro1 Ca2+ sensitivity are indicated by (KK). Residues corresponding to GTPase, EF-hand, and transmembrane (TM) domains are shown. (E) Representative immunoblots are shown for anti-Myc from DRG neurons transfected with Myc-Miro1K105A, Myc-Miro1K525A, or Myc-Miro1K629A plasmids and treated with 10 µM TubA for 4 h at 36 h after transfection (40 h in vitro). Input (10%) and immunoprecipitations with nonimmune IgG and Ac-Lys antibody cocktail. (F) Representative immunoblots are shown for anti–Miro1-AcK105 for DRG lysates ± 10 µM TubA. For the righthand blot, the anti–Miro1-AcK105 antibody was preincubated with 100 µg/ml immunizing peptide (short exposure = 30 s; long exposure = 3 min). (G and H) Representative immunoblots are shown in G for anti–Miro1-AcK105, anti-Miro1, and anti-Erk1 (loading control) from lysates of DRG cultures treated with 10 µg/ml aggrecan (CSPG) or 1 µM thapsigargin (Thapsi) for 4 h. H shows quantification of immunoblot signals across multiple experiments as average fold-change relative to control ± SEM (n = 3; *, P ≤ 0.05 by one-way ANOVA with pairwise comparison and Tukey post hoc tests). (I and J) Representative confocal projection images (XYZ) for anti-Miro1-AcK105 (Cy5), anti-NF (Cy3), and MitoTracker Green are shown as indicated in J for control, aggrecan-treated (CSPG) or thapsigargin-treated cultures. ImageJ was used for pseudocoloring and channel merging. Panel I shows quantification of the axonal anti-Miro1-AcK105 signals under these conditions as average fold-change relative to control ± SEM (n = 20; *, P ≤ 0.05 by one-way ANOVA with pairwise comparison and Tukey post hoc; scale bar = 20 µm; 100×/1.4 NA objective used).
Figure 7.
Figure 7.
Acetylation of Miro1 on K105 increases mitochondrial transport and supports axon growth on CNS growth inhibitory substrates. (A) End-point FRAP analysis for Mito-GFP in distal axons of DRGs transfected with either Myc-Miro1 (WT) or Myc-Miro1KK (KK) plasmids and cultured on laminin ± bath-applied 10 µg/ml aggrecan (CSPG) is shown as average of normalized percentage recovery ± SEM at 960 s after bleach (n ≥ 16 axons over four culture preparations; ***, P ≤ 0.005 vs. control + WT; ###, P ≤ 0.005 vs. control + Miro1KK; ΔΔ, P ≤ 0.01 vs. CSPG + WT by two-way ANOVA with Tukey post hoc). (B) Miro-KK expression prevents aggrecan-dependent decrease in axonal ψM as evidenced by JC-1 fluorescence ratio for DRGs cultured on laminin-coated (Cntl) versus aggrecan-coated (CSPG) coverslips. Average ratio ± SEM is shown (n = 20; *, P ≤ 0.05; ***, P ≤ 0.005 vs. control; ###, P ≤ 0.005 vs. CSPG by one-way ANOVA with pairwise comparison and Tukey post hoc). (C) DRGs transfected as in B were cultured on laminin (Cntl) or aggrecan (CSPG) substrates. Axon length assessed at 72 h after transfection is shown as average total axon length/neuron ± SEM (n ≥ 95 each over three DRG cultures; ***, P ≤ 0.005 vs. control + WT; ###, P ≤ 0.005 vs. control + Miro-KK; ΔΔ, P ≤ 0.01 vs. CSPG + WT as determined by two-way ANOVA with Tukey post hoc). (D) FRAP analyses for Mito-GFP in distal axons of DRGs transfected with Myc-Miro1, Myc-Miro1K105Q, or Myc-Miro1K629Q and cultured on laminin and then ± bath-applied 10 µg/ml aggrecan (CSPG) are shown as average normalized percentage recovery ± SEM (n ≥ 9 axons over three culture preparations; **, P ≤ 0.005 for indicated treatments by two-way ANOVA with Tukey honestly significant difference [HSD] post hoc). (E) Representative immunofluorescent images for Myc-Miro1 or Myc-Miro1K105Q (FITC) and NF (Cy5) along axons of cultured DRG neurons shows that both proteins localize to axons and colocalize with MitoTracker signals. See Fig. S7 A for Myc-Miro1K105A, Myc-Miro1K629Q, and Myc-Miro1K629A immunofluorescence (scale bar = 10 µm; 100×/1.4 NA objective used). (F) Percentage of moving axonal mitochondrial showing anterograde (blue) versus retrograde (red) directions in DRG neurons transfected with indicated Myc-tagged Miro1 constructs and plated on aggrecan (CSPG). Average values ± SEM are shown. See Fig. S7 B for axonal mitochondrial dynamics for these neurons cultured on laminin and Fig. S6 C for analyses of transport speed for laminin and CSPG cultured DRGs (n = 20 axons over three culture preparations; *, P ≤ 0.05 by one-way ANOVA with pairwise comparison and Tukey post hoc). (G) Percentage of retrogradely (red) and anterogradely (blue) moving mitochondria in growth cone of rat adult DRG neurons expressing Myc-Miro1K105Q or Myc-Miro1K105A and mito-GFP when axons are exposed to CSPG-coated versus control BSA-coated microspheres. Average values ± SEM are shown; note that Fig. S7 D shows that axonal mitochondrial transport is affected only by axonal exposure to the CSPG microspheres and when presented at the cell body (n = 15 axons over three culture preparations; *, P ≤ 0.05 by one-way ANOVA with pairwise comparison and Tukey post hoc). (H) Axon growth on substrate-bound aggrecan (CSPG) for DRGs transfected with Miro1 WT, KK, or acetyl-mimetic mutants (K105Q and K629Q) plasmids is shown as average total axon length/neuron ± SEM. Axon length was assessed at 72 h after transfection (n ≥ 75 each over three DRG cultures; **, P ≤ 0.005 vs. WT; ###, P ≤ 0.001 vs. Miro1KK and Miro1K105Q by two-way ANOVA with Tukey HSD post hoc). Myc-Miro-KK and Myc-Miro1K105Q are not statistically different. (I) End-point FRAP is shown for Mito-GFP recovery in distal axons of DRGs transfected with either Miro1 K105Q or K629Q plasmids and cultured on laminin followed by treatment with 1 µM thapsigargin plus vehicle control (DMSO), or 10 µM TubA is shown as average of normalized percentage recovery ± SEM at 960 s after bleach (n ≥ 16 axons over four culture preparations; **, P ≤ 0.01 vs. Miro1K105Q control or Miro1K629Q control; ##, P ≤ 0.01 vs. Miro1K105Q + TubA by two-way ANOVA with Tukey HSD post hoc).

Comment in

References

    1. Andrews S., Gilley J., and Coleman M.P.. 2010. Difference Tracker: ImageJ plugins for fully automated analysis of multiple axonal transport parameters. J. Neurosci. Methods. 193:281–287. 10.1016/j.jneumeth.2010.09.007 - DOI - PubMed
    1. Baas P.W., and Black M.M.. 1990. Individual microtubules in the axon consist of domains that differ in both composition and stability. J. Cell Biol. 111:495–509. 10.1083/jcb.111.2.495 - DOI - PMC - PubMed
    1. Babic M., Russo G.J., Wellington A.J., Sangston R.M., Gonzalez M., and Zinsmaier K.E.. 2015. Miro’s N-terminal GTPase domain is required for transport of mitochondria into axons and dendrites. J. Neurosci. 35:5754–5771. 10.1523/JNEUROSCI.1035-14.2015 - DOI - PMC - PubMed
    1. Benowitz L.I., He Z., and Goldberg J.L.. 2017. Reaching the brain: Advances in optic nerve regeneration. Exp. Neurol. 287:365–373. 10.1016/j.expneurol.2015.12.015 - DOI - PubMed
    1. Benoy V., Van Helleputte L., Prior R., d’Ydewalle C., Haeck W., Geens N., Scheveneels W., Schevenels B., Cader M.Z., Talbot K., et al. . 2018. HDAC6 is a therapeutic target in mutant GARS-induced Charcot-Marie-Tooth disease. Brain. 141:673–687. 10.1093/brain/awx375 - DOI - PMC - PubMed

Publication types

MeSH terms

Associated data