. 2019 Jun 28;93(14):e00500-19.
doi: 10.1128/JVI.00500-19. Print 2019 Jul 15.

Single-Cell Virus Sequencing of Influenza Infections That Trigger Innate Immunity

Affiliations

Single-Cell Virus Sequencing of Influenza Infections That Trigger Innate Immunity

Alistair B Russell et al. J Virol. .

Abstract

Influenza virus-infected cells vary widely in their expression of viral genes and only occasionally activate innate immunity. Here, we develop a new method to assess how the genetic variation in viral populations contributes to this heterogeneity. We do this by determining the transcriptome and full-length sequences of all viral genes in single cells infected with a nominally "pure" stock of influenza virus. Most cells are infected by virions with defects, some of which increase the frequency of innate-immune activation. These immunostimulatory defects are diverse and include mutations that perturb the function of the viral polymerase protein PB1, large internal deletions in viral genes, and failure to express the virus's interferon antagonist NS1. However, immune activation remains stochastic in cells infected by virions with these defects and occasionally is triggered even by virions that express unmutated copies of all genes. Our work shows that the diverse spectrum of defects in influenza virus populations contributes to-but does not completely explain-the heterogeneity in viral gene expression and immune activation in single infected cells.IMPORTANCE Because influenza virus has a high mutation rate, many cells are infected by mutated virions. But so far, it has been impossible to fully characterize the sequence of the virion infecting any given cell, since conventional techniques such as flow cytometry and single-cell transcriptome sequencing (scRNA-seq) only detect if a protein or transcript is present, not its sequence. Here we develop a new approach that uses long-read PacBio sequencing to determine the sequences of virions infecting single cells. We show that viral genetic variation explains some but not all of the cell-to-cell variability in viral gene expression and innate immune induction. Overall, our study provides the first complete picture of how viral mutations affect the course of infection in single cells.

Keywords: 10x Chromium; NS1; PB1; PacBio; defective virus; heterogeneity; influenza virus; interferon; single-cell RNA-seq.


Figures

FIG 1
FIG 1
Reporter cells to identify and enrich infections that activate IFN expression. (A) The reporter consists of an IFN promoter that drives expression of a cell surface protein amenable to MACS and a fluorescent protein. We created reporters with type I and type III IFN promoters (see File S1 in the supplemental material). In A549 cells, the reporters were efficiently activated by an IFN-inducing strain of Sendai virus (Fig. S1A). (B) Frequency of IFN induction upon infection with the influenza virus stock used in the single-cell studies in this paper, as quantified using the type III IFN reporter (see Fig. S2 for full flow cytometry data). The plot also shows data from uninfected cells and cells infected with Sendai virus. The limit of detection of 0.05% is indicated with a dashed line, and numbers show the medians from three measurements.
FIG 2
FIG 2
Approach for combined transcriptomics and viral sequencing of single influenza virus-infected cells that express IFN. (A) IFN reporter A549 cells are infected with a mix of wild-type and synonymously barcoded viruses. IFN+ cells are enriched by MACS and pooled with nonenriched cells and uninfected canine cells that serve as controls for multiplets and mRNA leakage. (B) The mRNAs from individual cells are converted to cDNAs tagged with cell-specific barcodes. (C) Cellular transcriptomes are quantified using standard single-cell 3′-end Illumina sequencing, and (D) viral genes are enriched by influenza virus-specific PCR and fully sequenced by PacBio (in this schematic, only the cell labeled by the red barcode is infected and has viral transcripts that are sequenced by PacBio). (E) The result is a matrix giving the expression of each gene in each cell, as well as the full sequences of the viral genes in infected cells.
FIG 3
FIG 3
Single-cell transcriptomics of IFN-enriched influenza virus-infected cells. (A) Numbers of cells from which transcriptomes were obtained. From these numbers, we estimate (59) that approximately 11% of the transcriptomes were derived from multiple cells. (B) The numbers of cellular and viral mRNAs detected for each cell are plotted as a point. Green lines show the distribution of cellular mRNAs per cell. Cells outside the dashed magenta lines have unusually low or high cellular mRNA (likely low-quality emulsions or multiplets) and were excluded from subsequent analyses. (C) Distribution across cells of the fraction of all mRNA derived from influenza virus. Cells called as infected are in blue, while other cells are in green. The inset shows the amount of viral mRNA in the human cells that are called as infected. (D) Numbers of influenza genes detected per infected cell, and the amounts of viral mRNA in cells expressing each number of viral genes. Figure S4 shows the frequency that each viral gene is detected. (E) Relative expression of viral genes, quantified as the fraction of all viral mRNA in each infected cell derived from each gene. (F) Numbers of cells infected with wild-type virus, synonymously barcoded virus, or both. From the cells infected with both viral barcodes, we estimate (59) that 63% of infected cells were coinfected. (G) Fractions of cellular mRNA from IFN across cells, faceted by whether the cells were infected. Cells to the left of the first dashed magenta line were classified as IFN and cells to the right of the second line as IFN+. A pseudocount is added to the number of IFN transcripts detected in each cell, which is why none of the fractions are zero.
FIG 4
FIG 4
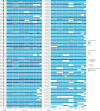
Viral genotypes and infection outcomes in single cells. Green and orange boxes at the left show the percentage of all mRNA in that cell derived from virus and the percentage of all cellular mRNA derived from IFN, respectively. The second box is framed in orange for cells classified as IFN+ in Fig. 3G. Blue arrows indicate the presence of a viral gene from one (light blue) or both (dark blue) viral barcode variants; a dark blue arrow therefore means that a cell was coinfected. Circles and boxes on the arrows indicate mutations or indels as described in the legend at right. The circle areas and box heights are proportional to the fraction of CCSs with that mutation. For dual-barcode infections, mutations/indels for the wild-type and synonymously barcoded viral variants are shown in the top and bottom half of the arrows, respectively. For instance, cell 5 was coinfected by a virion with one unmutated and one internally deleted copy of PB1.
FIG 5
FIG 5
Viral features associated with heterogeneity in infection outcome among cells for which we determined viral genotypes. (A) Percentages of all mRNA derived from virus, faceted by whether cells expressed unmutated copies of all eight genes. Cells infected by fully unmutated virions exhibited less heterogeneity in viral burden as quantified by the Gini index (95% confidence intervals are indicated). (B) IFN expression among cells expressing unmutated copies of all genes and among cells with mutations or missing genes. (C) Specific viral defects associated with IFN induction. The top panel shows the percentages of IFN and IFN+ cells that failed to express each viral gene. The middle and bottom panels show the percentages of IFN and IFN+ cells that had a deletion or amino acid substitution in each gene, conditioned on the cell expressing that gene. Numbers give P values (Fisher’s exact test) for rejecting the null hypothesis that percentages are equal among IFN and IFN+ cells. (D) There was no association between IFN induction and the amount of viral mRNA in cells that expressed NS, but viral burden was associated with IFN induction among cells that lacked NS. Throughout this figure, we only consider substitutions that are nonsynonymous.
FIG 6
FIG 6
Validation that IFN induction is increased by some of the mutations identified in the single-cell virus sequencing of IFN+ cells. (A) Percentages of infected cells that became IFN+ after infection with a bulk stock of the indicated viral mutant, as determined using a reporter cell line. The numbers indicate the medians from four measurements for each viral mutant. The limit of detection of 0.05% is indicated with a dashed green line, and the median value for the wild-type viral stock is indicated with a dashed blue line. Points are colored orange if the mutant virus stock induced IFN more frequently than the wild-type viral stock (one-sided t test, P < 0.01) and blue otherwise. (B) Similar to the first panel but validates increased IFN induction for a large internal deletion in the PB1 gene and normalizes infecting virion dose rather than calling IFN+ percentage only among infected cells. See Fig. S12 and S13 for details. The experiments in the two panels were performed on different days, and so numerical values can be reliably compared within panels but not between panels.
FIG 7
FIG 7
Infected cells that express higher levels of HA protein are much more likely to induce IFN expression only if they are infected by virus with defects in NS1. The y axis shows the ratios of the percentage of IFN+ cells in the highest HA expression quartile relative to the lowest HA expression quartile. Points indicate replicates, and lines indicate the means. This figure is based on joint analysis of the IFN reporter and HA staining for all infected cells in the flow cytometry data in Fig. S12; see Fig. S14 for more details.
FIG 8
FIG 8
IFN-inducing mutations D27N and T677A in the PB1 protein affect polymerase activity. (A) Model of bat influenza A virus polymerase (PDB 4WSB) (93) superposed with the influenza B virus polymerase (PDB 5MSG) (94). The locations of PB1 D27 and T677 (both red) relative to the 5′ (blue) and 3′ (orange) termini of the RNA template and the PB1 active site (gray; PB1 act) are indicated. The PA endonuclease (green; PA endo) and PB2 cap binding domain (pink; PB2 cap) are also indicated. Part of the fingers subdomain of PB1 is hidden to reveal the template in the entry channel. (B) IFN-β promoter activity measured using a dual luciferase reporter assay in 293T cells transfected with plasmids expressing the indicated PB1 protein, the other polymerase complex proteins (PB2, PA, and NP), and a full-length NA vRNA template. PB1a is a catalytically inactive PB1 active site control. In this panel and the next two panels, points show three biological replicates; “n.d.” indicates not detectable, and orange indicates a variant was significantly different than wild type by a two-sided t test. (C) Polymerase activity on full-length vRNA template in 293T cells transfected as in panel B. Steady-state RNA levels were measured by primer extension, denaturing PAGE, and phosphorimaging. PB1a was used as negative control and background correction. The 5S rRNA signal was used as loading control. Other panels show Western blot analysis of PB1, NP, and GAPDH (glyceraldehyde-3-phosphate dehydrogenase) protein expression, and the graph at the bottom shows quantification by phosphorimaging. (D) Polymerase activity on a short 246-nucleotide vRNA template. The top panel shows the steady-state levels of vRNA template as determined by primer extension and denaturing PAGE. The other two panels show the PB1 and tubulin expression levels analyzed by Western blotting, and the graph shows quantification.

References

    1. Stetson DB, Medzhitov R. 2006. Type I interferons in host defense. Immunity 25:373–381. doi:10.1016/j.immuni.2006.08.007. - DOI - PubMed
    1. Honda K, Takaoka A, Taniguchi T. 2006. Type I interferon gene induction by the interferon regulatory factor family of transcription factors. Immunity 25:349–360. doi:10.1016/j.immuni.2006.08.009. - DOI - PubMed
    1. Solov’ev V. 1969. The results of controlled observations on the prophylaxis of influenza with interferon. Bull World Health Organ 41:683–688. - PMC - PubMed
    1. Treanor JJ, Betts RF, Erb SM, Roth FK, Dolin R. 1987. Intranasally administered interferon as prophylaxis against experimentally induced influenza A virus infection in humans. J Infect Dis 156:379–383. doi:10.1093/infdis/156.2.379. - DOI - PubMed
    1. Beilharz MW, Cummins JM, Bennett AL. 2007. Protection from lethal influenza virus challenge by oral type 1 interferon. Biochem Biophys Res Commun 355:740–744. doi:10.1016/j.bbrc.2007.02.019. - DOI - PubMed

Publication types

MeSH terms

Substances