. 2019 May 8;11(491):eaau8587.
doi: 10.1126/scitranslmed.aau8587.

HBEGF+ macrophages in rheumatoid arthritis induce fibroblast invasiveness

Affiliations

HBEGF+ macrophages in rheumatoid arthritis induce fibroblast invasiveness

David Kuo et al. Sci Transl Med. .

Abstract

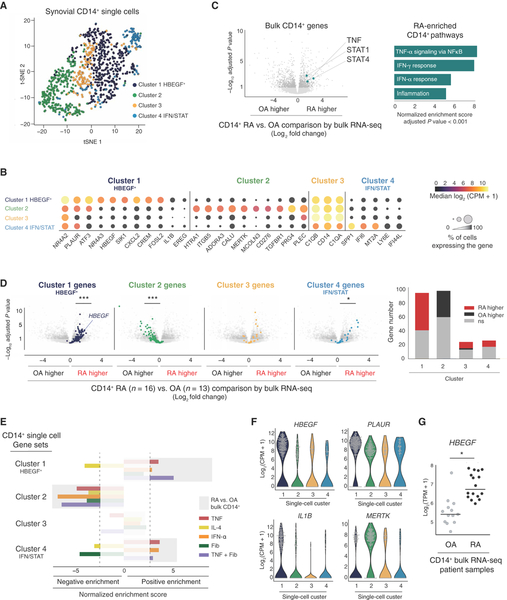
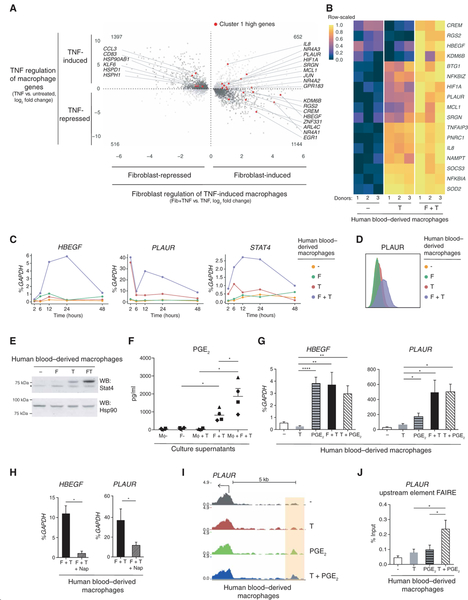
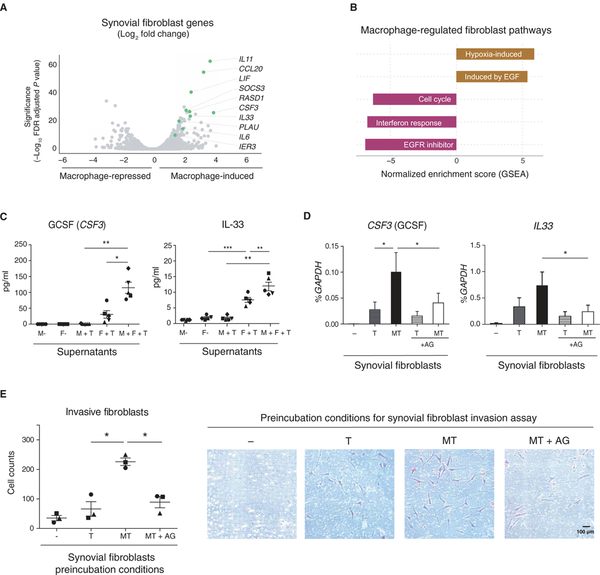
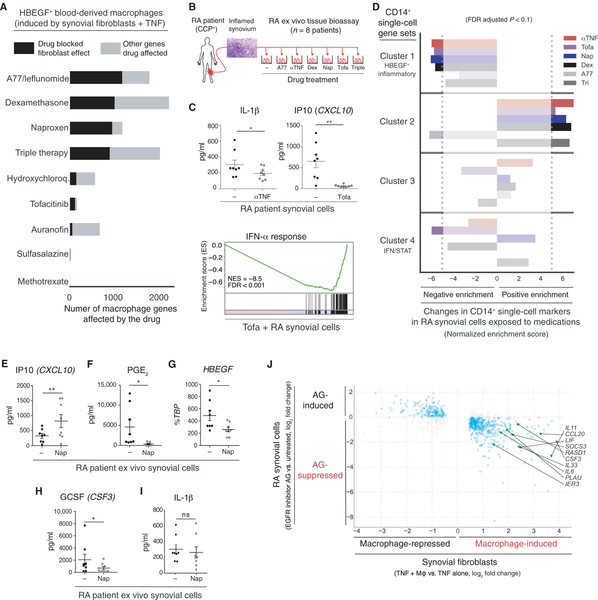
Macrophages tailor their function according to the signals found in tissue microenvironments, assuming a wide spectrum of phenotypes. A detailed understanding of macrophage phenotypes in human tissues is limited. Using single-cell RNA sequencing, we defined distinct macrophage subsets in the joints of patients with the autoimmune disease rheumatoid arthritis (RA), which affects ~1% of the population. The subset we refer to as HBEGF+ inflammatory macrophages is enriched in RA tissues and is shaped by resident fibroblasts and the cytokine tumor necrosis factor (TNF). These macrophages promoted fibroblast invasiveness in an epidermal growth factor receptor-dependent manner, indicating that intercellular cross-talk in this inflamed setting reshapes both cell types and contributes to fibroblast-mediated joint destruction. In an ex vivo synovial tissue assay, most medications used to treat RA patients targeted HBEGF+ inflammatory macrophages; however, in some cases, medication redirected them into a state that is not expected to resolve inflammation. These data highlight how advances in our understanding of chronically inflamed human tissues and the effects of medications therein can be achieved by studies on local macrophage phenotypes and intercellular interactions.


Conflict of interest statement

Competing interests:

M.B.B. serves on a scientific advisory board for GlaxoSmithKline and receives royalties from Roche. D.K. is an employee of Juno Therapeutics, a Celgene Company. The other authors declare that they have no competing interests to declare.

Figures

Fig. 1.
Fig. 1.. HBEGF+ inflammatory macrophages in RA joints identified by scRNA-seq.
(A) Human synovial CD14+ single-cell clusters (940 cells). CD45+CD14+ cells were flow-sorted from synovial tissue of patients with RA (n = 10) or OA (n = 2) and processed by plate-based scRNA-seq. (B) CD14+ single-cell cluster marker genes. Median expression of a gene across all cells in cluster is indicated by color and the percentage of cells expressing the gene in each cluster is indicated by size. (C) Differential gene expression of bulk CD14+ synovial cell populations from patients with RA (n = 16) versus OA (n = 13) plotted as log2 fold change with −log10 FDR adjusted P value; dark gray <0.1. Right: Positively enriched pathways in RA bulk CD14+ cells. (D) CD14+ single-cell cluster marker genes highlighted on the bulk RA versus OA plot from (C) (up to 100 genes shown per cluster, Bonferroni-corrected P < 0.1, expressed in ≥30% of cells). Hypergeometric test: ***P < 10−6, *P < 10−3. Right: Number of cluster genes higher in RA or OA bulk comparison or not significant (ns) (FDR adjusted P < 0.1). (E) GSEA using the CD14+ single-cell markers as gene sets and ranked gene lists from human blood–derived macrophages exposed to various stimuli (colored bars) or the bulk CD14+ RA versus OA analysis (background: gray bars). |NES| (normalized enrichment scores) > 2.5 were significant at FDR adjusted P < 0.001. (F) Gene expression for each CD14+ single cell plotted as log2 counts per million (CPM) + 1. (G) HBEGF expression in CD14+ bulk cell populations from individual patients, plotted as log2 transcripts per million (TPM) + 1. n = 16 RA and n = 13 OA samples. *Bonferroni-corrected P < 10−3.
Fig. 2.
Fig. 2.. HBEGF+ inflammatory macrophage polarization by tissue fibroblasts.
(A) Human blood–derived macrophage genes regulated by synovial fibroblasts and TNF (3709 genes, FDR adjusted P < 0.1; n = 4 donors). Expression changes plotted as log2 fold. The x-axis plots fibroblasts + TNF versus TNF; the y axis plots TNF versus untreated. HBEGF+ cluster 1 single-cell markers labeled in red (expressed in >55% of cells, Bonferroni-corrected P < 10−6). (B) Expression of select synovial CD14+ cluster 1 genes in the blood-derived macrophages exposed to TNF (T) or fibroblasts + TNF (F + T). n = 3 donors. (C) qPCR of blood-derived macrophage gene expression over time, plotted as percentage (%) of GAPDH (glyceraldehyde-3-phosphate dehydrogenase). Representative of n = 4 donors. (D) The PLAUR gene cell surface protein product (CD87) detected by flow cytometry in blood-derived macrophage cultures at 24 hours. (E) Western blot of STAT4 in blood-derived macrophage cultures at 24 hours. Representative of n = 4 donors. Asterisk (*) denotes nonspecific band. Hsp90, loading control. (F) PGE2 enzyme-linked immunosorbent assay (ELISA) using supernatants from blood-derived macrophage (Mϕ) cultures at 24 hours. n = 4 donors. Data are means ± SEM. (G) qPCR of blood-derived macrophage gene expression in cultures at 24 hours. n = 8 donors. (H) qPCR of blood-derived macrophage gene expression in culture at 24 hours. Nap, COX inhibitor naproxen (150 nM). (I) ATAC-seq tracks from PLAUR gene promoter regions in blood-derived macrophage cultures at 3 hours. The region with light orange highlight is further examined in (J). The arrow indicates transcription start site. (J) FAIRE-qPCR analysis of open chromatin for the region highlighted in (I), % total input reported as mean ± SEM. n = 4 donors. *P < 0.05, **P < 0.01, and ****P < 0.0001.
Fig. 3.
Fig. 3.. HBEGF+ inflammatory macrophages promote EGFR-dependent synovial fibroblast pathologic activity.
(A) Human synovial fibroblast genes altered by blood-derived macrophages during a TNF response (885 genes differentially expressed), RNA-seq, 48 hours. n = 2 donors. x axis: log2 fold change by macrophages. y axis: significance as the −log10 FDR adjusted P value. (B) Fibroblast pathways regulated by macrophages under TNF conditions (GSEA and IPA). Macrophage-induced, brown. Macrophage–down-regulated, maroon. (C) ELISA assay using supernatants of synovial fibroblast (F) cultures with or without macrophages (M) and TNF (T) for 48 hours. n = 4 donors for both, reported as mean with SEM. (D) qPCR on fibroblast cultures at 32 hours. EGF receptor inhibitor, AG 1478 (AG, 4 μM). Mean ± SEM. n = 6 donors. (E) Cell counts and photomicrographs of synovial fibroblast Matrigel invasion assay with crystal violet stain, 18 hours after a 24-hour preincubation with macrophages (M), TNF (T), and the EGFR inhibitor (AG). n = 3 donors. *P < 0.05, **P < 0.01, and ***P < 0.001 by paired Student’s t test, respectively.
Fig. 4.
Fig. 4.. Clinically effective RA medications and a therapeutic EGFR inhibitor target HBEGF+ inflammatory macrophage-fibroblast cross-talk in RA tissue.
(A) Number of blood-derived macrophage genes affected by RA medications in the presence of TNF and synovial fibroblasts from cultures at 24 hours. Black, fibroblast-regulated genes opposed by drug. Gray, all other genes regulated by drug. FDR adjusted P < 0.1. n = 2 to 4 donors. (B) RA patient synovial tissue ex vivo drug response assay using highly inflamed synovium (scored by histology) from patients with positive blood titers for anti–cyclic citrullinated peptide (CCP+) antibodies. Dissociated cells placed into culture were exposed to a panel of medications for 24 hours. αTNF, anti-TNF antibodies. (C) ELISA using supernatants from RA tissue ex vivo assay. n = 8 donors. *P < 0.05 and **P < 0.01 by Wilcoxon signed-rank test. Bottom: IFN-α response upon tofacitinib exposure, bulk RNA-seq, and GSEA. n = 2 donors. (D) Direction and intensity of change for CD14+ single-cell cluster markers in RA synovial cells exposed to various medications. Normalized enrichment scores (GSEA). (E, H, and I) ELISAs as described in (C). (F) PGE2 ELISA using supernatants. Data are means ± SEM. n = 7 donors. *P < 0.05, paired Student’s t test. (G) qPCR using ex vivo synovial cells treated with naproxen, plotted as percentage (%) of TBP. n = 7 donors. Data are means ± SEM. *P < 0.05, paired Student’s t test. (J) Gene expression changes induced by the EGFR inhibitor AG-1478 in RA patient ex vivo synovial cells (y axis) compared to changes in synovial fibroblasts induced by macrophages and TNF (x axis, data from Fig. 3A); n = 2 donors. FDR adjusted P < 0.1, plotted as a log2 fold change. Highlighted genes are from Fig. 3A.

References

    1. Rankin LC, Artis D, Beyond host defense: Emerging functions of the immune system in regulating complex tissue physiology. Cell 173, 554–567 (2018). - PubMed
    1. Wynn TA, Chawla A, Pollard JW, Macrophage biology in development, homeostasis and disease. Nature 496, 445–455 (2013). - PMC - PubMed
    1. Lavin Y, Winter D, Blecher-Gonen R, David E, Keren-Shaul H, Merad M, Jung S, Amit I, Tissue-resident macrophage enhancer landscapes are shaped by the local microenvironment. Cell 159, 1312–1326 (2014). - PMC - PubMed
    1. Okabe Y, Medzhitov R, Tissue biology perspective on macrophages. Nat. Immunol 17, 9–17 (2016). - PubMed
    1. Gosselin D, Link VM, Romanoski CE, Fonseca GJ, Eichenfield DZ, Spann NJ, Stender JD, Chun HB, Garner H, Geissmann F, Glass CK, Environment drives selection and function of enhancers controlling tissue-specific macrophage identities. Cell 159, 1327–1340 (2014). - PMC - PubMed

Publication types

Substances

LinkOut - more resources