. 2019 May 9;11(2):16.
doi: 10.1038/s41368-019-0049-y.

Mucosal-associated invariant T cells and oral microbiome in persistent apical periodontitis

Affiliations

Mucosal-associated invariant T cells and oral microbiome in persistent apical periodontitis

Haleh Davanian et al. Int J Oral Sci. .

Abstract

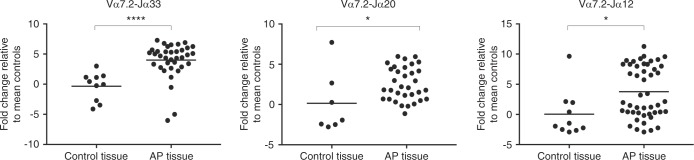
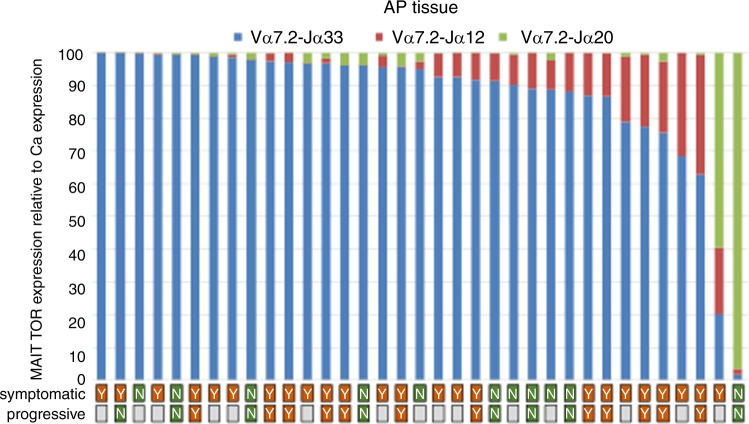
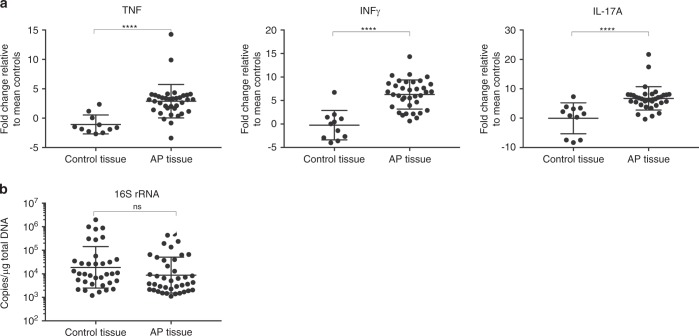
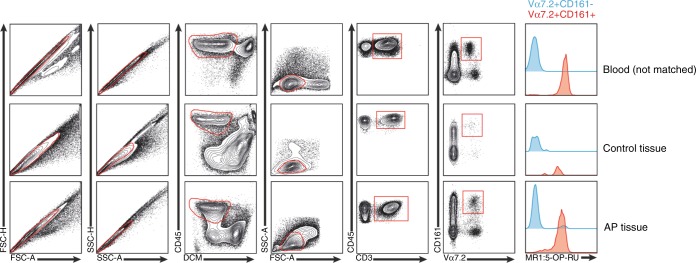
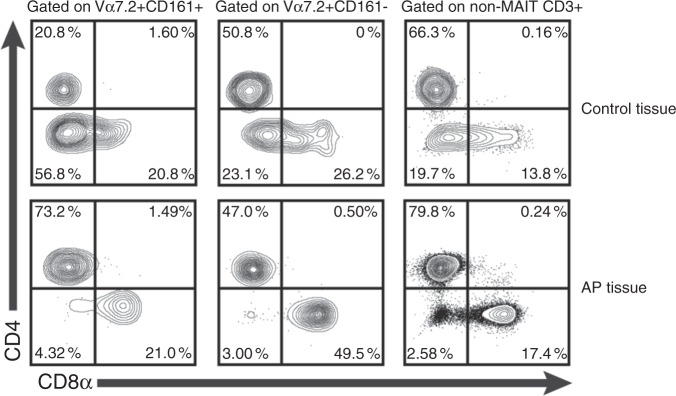
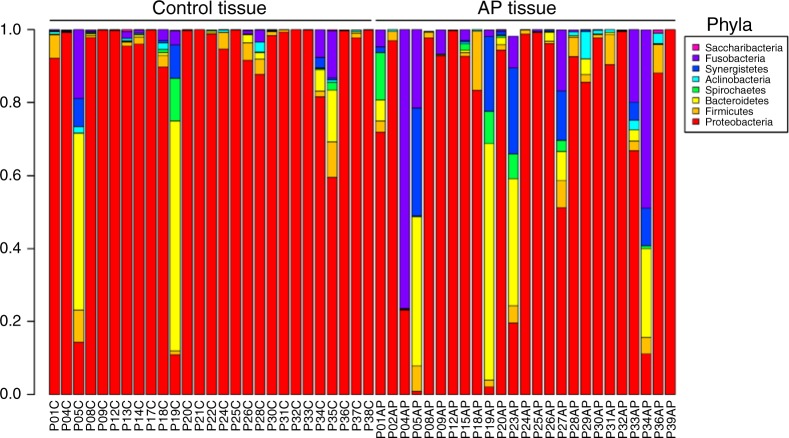
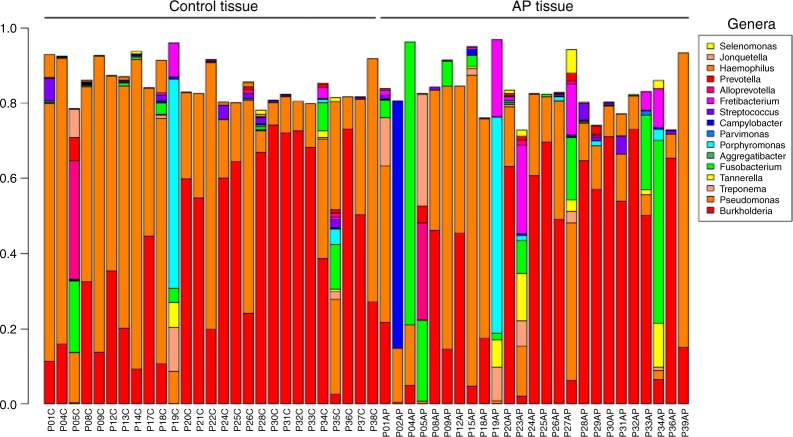
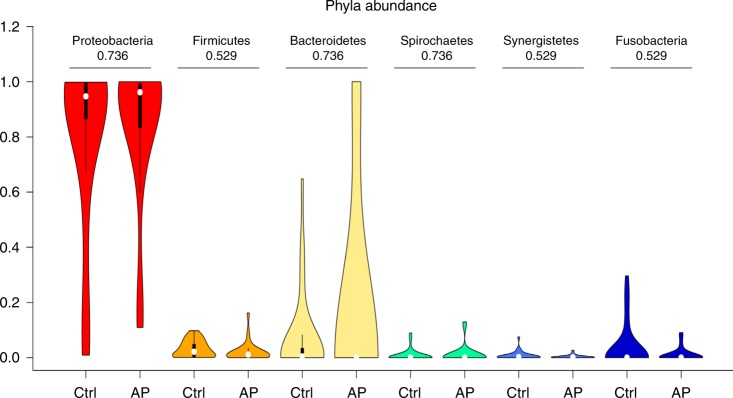
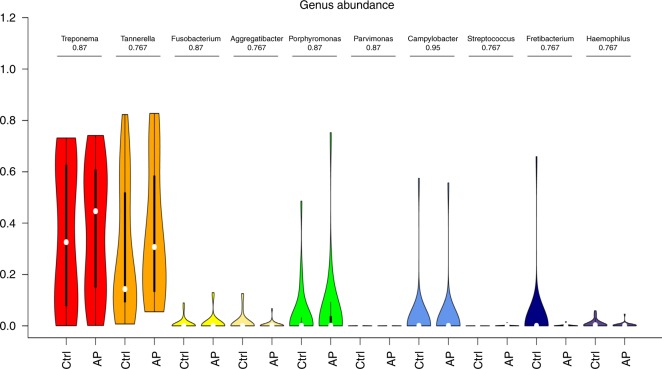
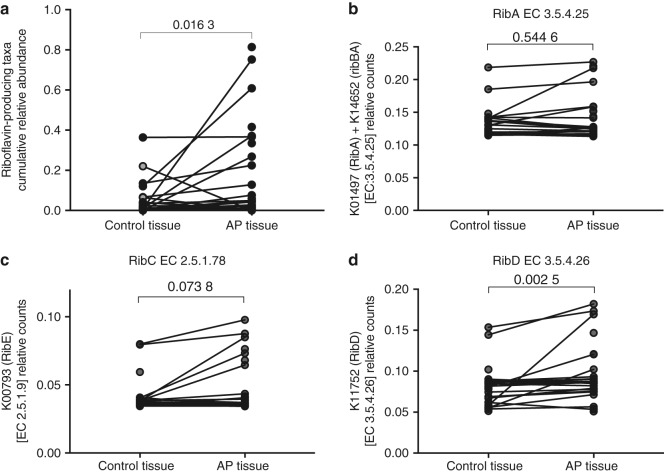
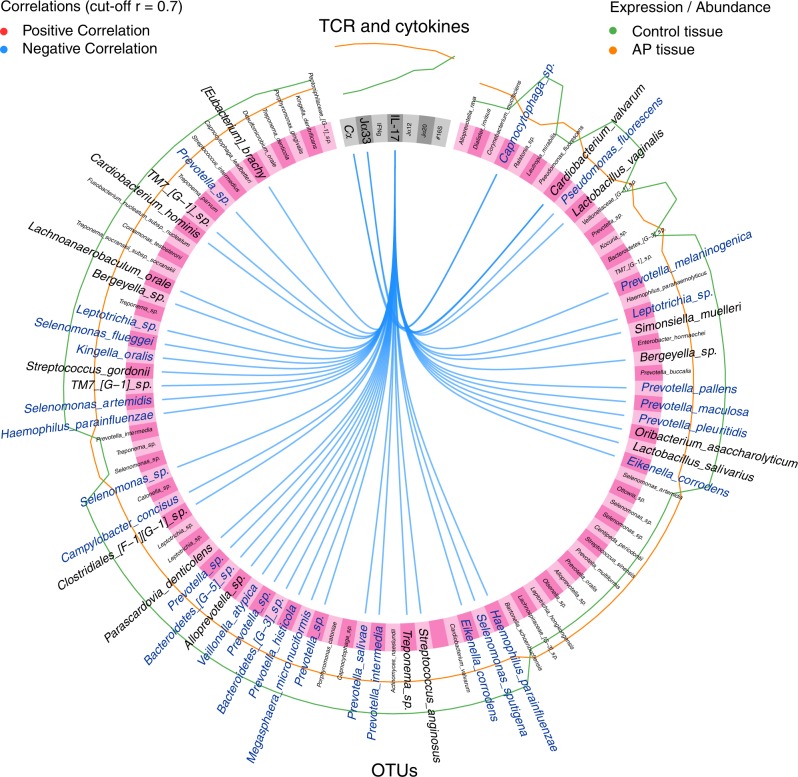
Opportunistic bacteria in apical periodontitis (AP) may pose a risk for systemic dissemination. Mucosal-associated invariant T (MAIT) cells are innate-like T cells with a broad and potent antimicrobial activity important for gut mucosal integrity. It was recently shown that MAIT cells are present in the oral mucosal tissue, but the involvement of MAIT cells in AP is unknown. Here, comparison of surgically resected AP and gingival tissues demonstrated that AP tissues express significantly higher levels of Vα7.2-Jα33, Vα7.2-Jα20, Vα7.2-Jα12, Cα and tumour necrosis factor (TNF), interferon (IFN)-γ and interleukin (IL)-17A transcripts, resembling a MAIT cell signature. Moreover, in AP tissues the MR1-restricted MAIT cells positive for MR1-5-OP-RU tetramer staining appeared to be of similar levels as in peripheral blood but consisted mainly of CD4+ subset. Unlike gingival tissues, the AP microbiome was quantitatively impacted by factors like fistula and high patient age and had a prominent riboflavin-expressing bacterial feature. When merged in an integrated view, the examined immune and microbiome data in the sparse partial least squares discriminant analysis could identify bacterial relative abundances that negatively correlated with Vα7.2-Jα33, Cα, and IL-17A transcript expressions in AP, implying that MAIT cells could play a role in the local defence at the oral tissue barrier. In conclusion, we describe the presence of MAIT cells at the oral site where translocation of oral microbiota could take place. These findings have implications for understanding the immune sensing of polymicrobial-related oral diseases.


Conflict of interest statement

The authors declare no competing interests.

Figures

Fig. 1
Fig. 1
Tissue expression of Vα7.2-Jα33, Vα7.2-Jα20, and Vα7.2-Jα12 in AP lesions and gingival control biopsies. The expression of Vα7.2-Jα33, Vα7.2-Jα20, and Vα7.2-Jα12 was significantly increased in AP tissues compared to donor-matched gingival control tissues. Expression levels were measured by reverse transcription-qPCR and graphed as the log2 fold-change relative to GAPDH expression. Statistical analysis was performed using Student’s t-tests. ns indicates non-significant, *, **, ***, and **** indicates P < 0.05, < 0.01, < 0.001, or < 0.000 1, respectively
Fig. 2
Fig. 2
The MAIT distribution. TCR typing of AP MAIT cells confirmed the Vα7.2-Jα33 as the dominant TCR rearrangement in the AP tissue
Fig. 3
Fig. 3
a The expression of TNF, IFN-γ, and IL-17A in AP lesions and gingival control biopsies. The expression of TNF, IFN-γ, and IL-17A was significantly increased in AP tissues compared to gingival control tissues harvested from same patients. b Quantification of tissue-associated microbial 16S DNA. Tissue 16S rRNA gene copy number per milligram total genomic DNA isolated from indicated tissue sample. Statistical significance of comparisons between groups was made using Mann–Whitney test
Fig. 4
Fig. 4
FACS analysis of single suspension cell isolates from AP and gingival control tissues. Gating strategy to define MAIT cells (Va7.2 + CD161high ) within the CD45 + subset in blood, control tissue, and AP granuloma and representative histogram of MR1:5-OP-RU tetramer stain of Vα7.2 + CD161high (MAIT) and Va7.2 + CD161low- cells (n = 2)
Fig. 5
Fig. 5
Contour plot of CD8α vs. CD4 expression in MAIT (Vα7.2 + CD161high) and non-MAIT CD3+ cells
Fig. 6
Fig. 6
Taxonomic profiles at the phylum levels. Bar plots displaying relative abundance of OTUs within an individual sample of gingival control tissues and AP tissue biopsies at the phylum level
Fig. 7
Fig. 7
Taxonomic profiles at the genus levels. Bar plots displaying relative abundance of OTUs within an individual sample of gingival control tissues and AP tissue biopsies at the genus level
Fig. 8
Fig. 8
Taxonomic abundances at the phylum levels. Violin plots showing the comparison of the relative abundance of selected bacterial taxa at phylum level between gingival control tissue samples and AP tissue samples with adjusted p-values being shown
Fig. 9
Fig. 9
Taxonomic abundances at the genus levels. Violin plots showing the comparison of the relative abundance of selected bacterial taxa at genus level between gingival control tissue samples and AP tissue samples with adjusted p-values being shown
Fig. 10
Fig. 10
Identification of the microbiota with known riboflavin-producing activity among annotated OTUs. a Cumulative relative abundance of riboflavin-producing bacterial taxa (predicted from literature and KEGG database search) in oral control tissue and paired AP tissue. Relative gene counts of b RibA, c RibE, and d RibD as inferred from 16S sequence data by PICRUSt in control tissue compared to AP tissue. Wilcoxon matched-pairs signed rank test (two-tailed) was used to assess statistically significant difference between the two groups, p-values are displayed
Fig. 11
Fig. 11
Circos plot showing correlation analysis of immunological parameters with microbiota data. Sparse partial least squares discriminant analysis (sPLS-DA) was used to identify a first and second component based on TCR- and cytokine expression levels or absolute 16S rRNA counts and OTU relative abundance. The most discriminative features that were selected by the model from TCR- and cytokine expression data (grey) and OTU abundance (pink) are shown, where the outermost lines represent the feature abundance or expression level in samples from control tissue (green) and AP tissue (orange). At a correlation cutoff of 0.7, only negative correlations (blue lines) between the features were found. Bacterial taxa presumed to have functional riboflavin biosynthesis pathways are highlighted in blue font

References

    1. Huumonen S, Vehkalahti MM, Nordblad A. Radiographic assessments on prevalence and technical quality of endodontically-treated teeth in the Finnish population, aged 30 years and older. Acta Odontol. Scand. 2012;70:234–240. doi: 10.3109/00016357.2011.637510. - DOI - PubMed
    1. Dutta A, Smith-Jack F, Saunders WP. Prevalence of periradicular periodontitis in a Scottish subpopulation found on CBCT images. Int. Endod. J. 2014;47:854–863. doi: 10.1111/iej.12228. - DOI - PubMed
    1. Pak JG, Fayazi S, White SN. Prevalence of periapical radiolucency and root canal treatment: a systematic review of cross-sectional studies. J. Endod. 2012;38:1170–1176. doi: 10.1016/j.joen.2012.05.023. - DOI - PubMed
    1. Huumonen S, Suominen AL, Vehkalahti MM. Prevalence of apical periodontitis in root filled teeth: findings from a nationwide survey in Finland. Int. Endod. J. 2017;50:229–236. doi: 10.1111/iej.12625. - DOI - PubMed
    1. van der Waal SV, Lappin DF, Crielaard W. Does apical periodontitis have systemic consequences? The need for well-planned and carefully conducted clinical studies. Br. Dent. J. 2015;218:513–516. doi: 10.1038/sj.bdj.2015.340. - DOI - PubMed