. 2019 May 8;10(1):2104.
doi: 10.1038/s41467-019-10137-9.

Initial state of DNA-Dye complex sets the stage for protein induced fluorescence modulation

Affiliations

Initial state of DNA-Dye complex sets the stage for protein induced fluorescence modulation

Fahad Rashid et al. Nat Commun. .

Abstract

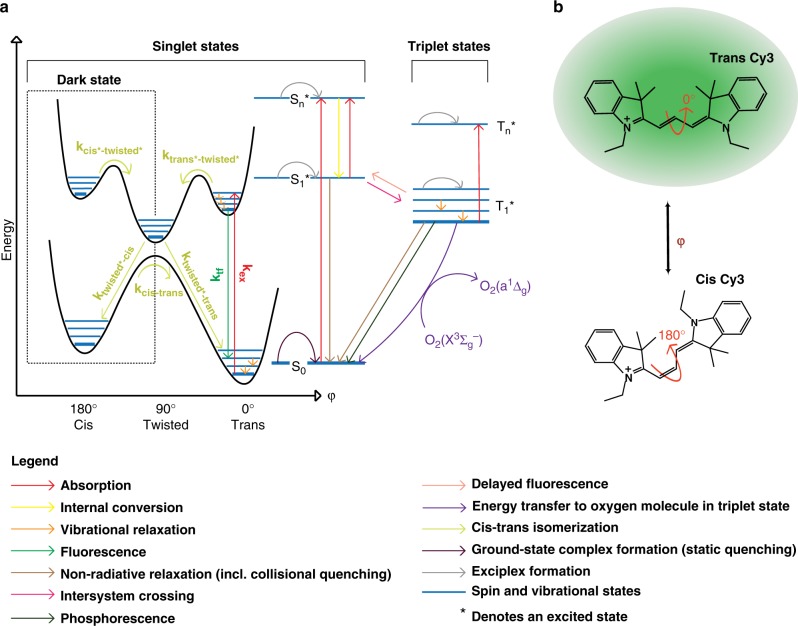
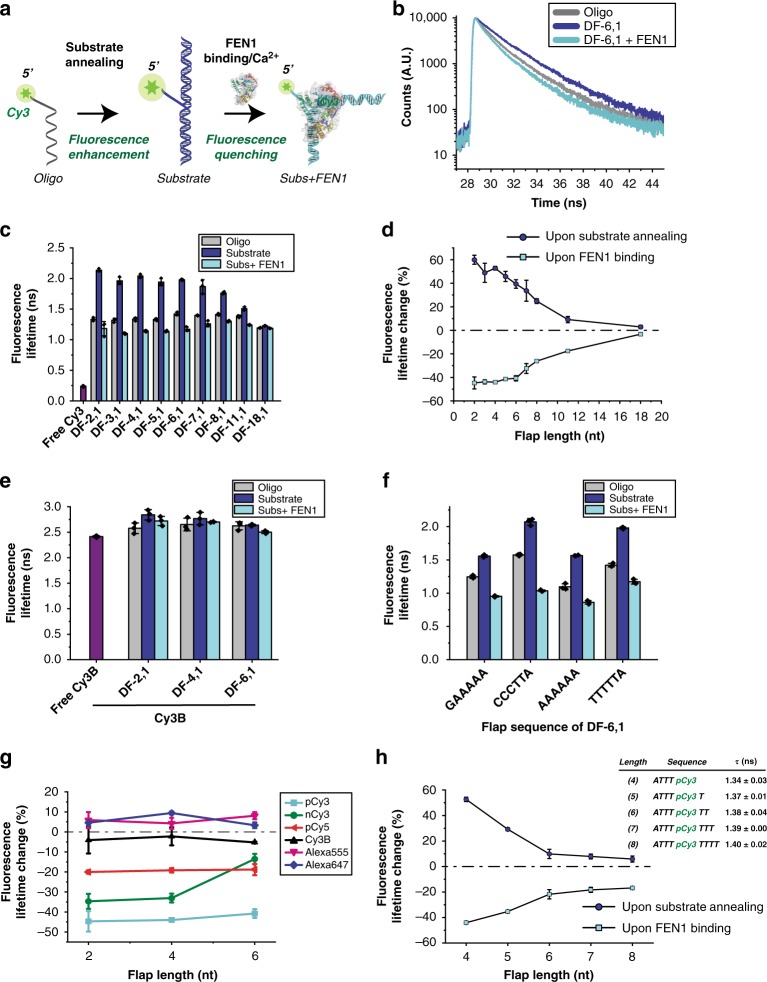
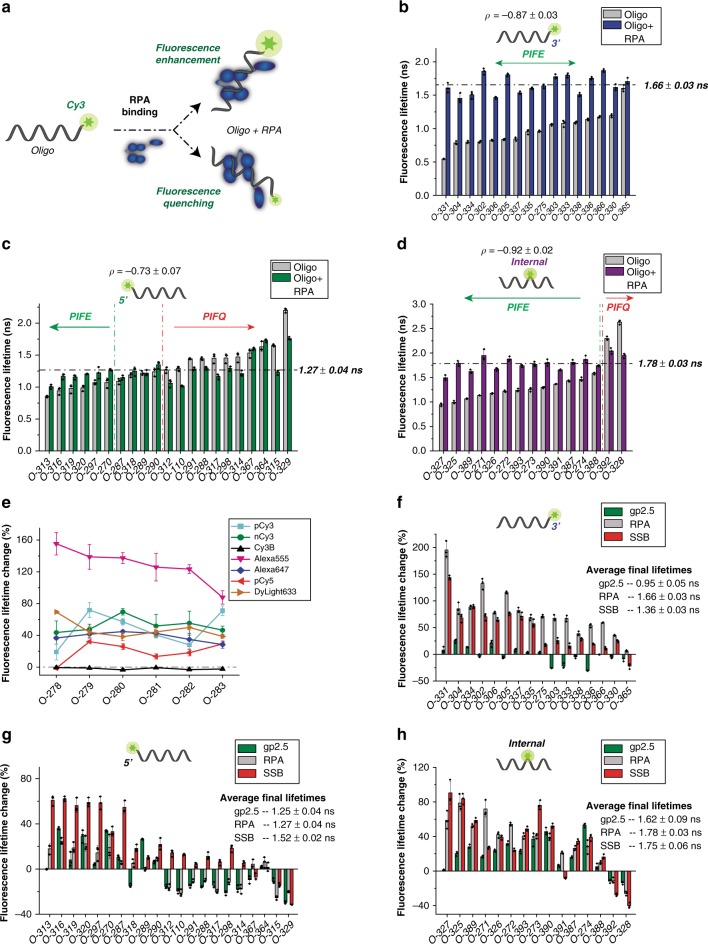
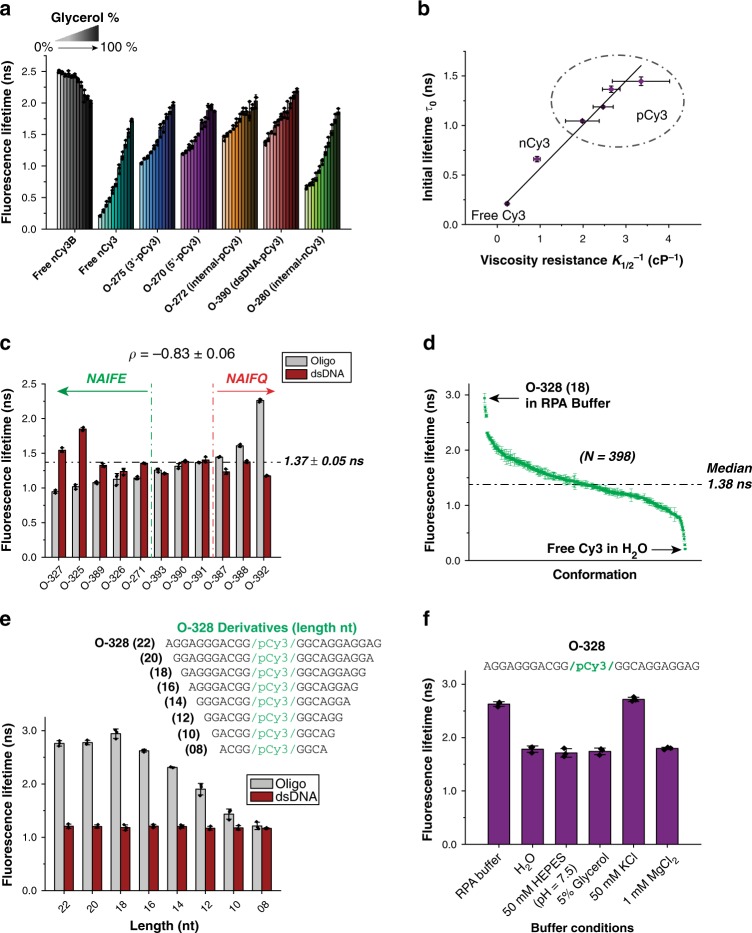
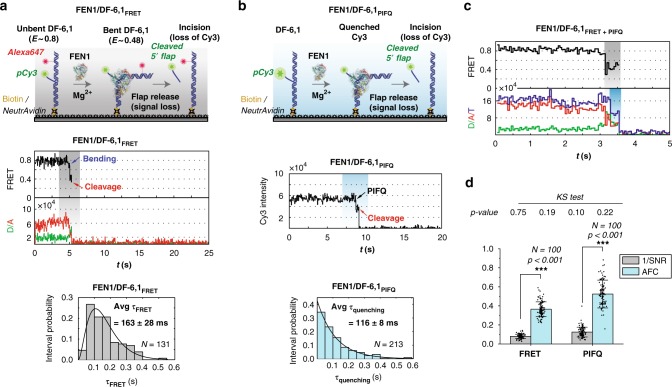
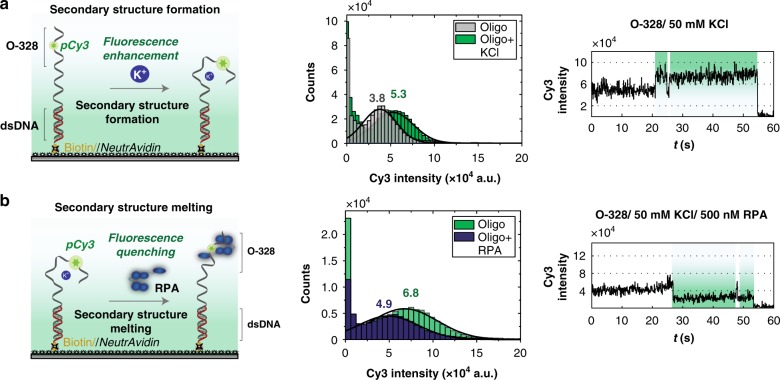
Protein-induced fluorescence enhancement (PIFE) is a popular tool for characterizing protein-DNA interactions. PIFE has been explained by an increase in local viscosity due to the presence of the protein residues. This explanation, however, denies the opposite effect of fluorescence quenching. This work offers a perspective for understanding PIFE mechanism and reports the observation of a phenomenon that we name protein-induced fluorescence quenching (PIFQ), which exhibits an opposite effect to PIFE. A detailed characterization of these two fluorescence modulations reveals that the initial fluorescence state of the labeled mediator (DNA) determines whether this mediator-conjugated dye undergoes PIFE or PIFQ upon protein binding. This key role of the mediator DNA provides a protocol for the experimental design to obtain either PIFQ or PIFE, on-demand. This makes the arbitrary nature of the current experimental design obsolete, allowing for proper integration of both PIFE and PIFQ with existing bulk and single-molecule fluorescence techniques.


Conflict of interest statement

The authors declare no competing interests.

Figures

Fig. 1
Fig. 1
Energy landscape of a cyanine dye. a Schematic representation of potential energy landscape for S0 (ground singlet) and S1* (first excited singlet) states as a function of single dihedral angle of the Cy3 polymethine bond, superposed on a Jablonski diagram. b Schematic representation of the Cy3 dye molecule and one of its dihedral angles, in fluorescent trans and dark cis configurations
Fig. 2
Fig. 2
DNA-mediated bidirectional fluorescence modulation in the FEN1/DF system. a Schematic showing the oligo bearing pCy3 at its 5′-tip, annealed to two other oligos to form a double flap structure (DF) that serves as a substrate for FEN1. The ssDNA flap part of the DF is threaded through a narrow pathway in FEN1 for cleavage to happen. b Time-resolved fluorescence lifetime decays of Cy3 in oligo alone (gray), upon making the DF substrate (blue) and upon addition of FEN1 to the DF substrate (cyan) with a 6 nt-long 5′-flap. c Bar chart showing time-resolved fluorescence lifetime of Cy3 in oligo alone, upon making the DF substrate and upon addition of FEN1 to the DF substrate for flap lengths 2–18 (color scheme is same as b). Fluorescence lifetime of free Cy3 dye is included (in purple) for comparison. d Graph showing percentage of change in fluorescence lifetime, upon annealing of the DF substrate and FEN1 binding to the annealed substrate as a function of flap length. e Bar chart graph showing the time-resolved fluorescence lifetime of Cy3B-labeled oligos alone, upon making the DF substrate and upon addition of FEN1 to the DF substrate for flap lengths 2, 4, and 6. Cy3B is linked to the DNA via a 13-carbon linker. f Bar chart showing the time-resolved fluorescence lifetime of Cy3 in the oligo alone, upon making the DF substrate, and upon addition of FEN1 to the DF substrate for 6 nt-long 5′-flap with different flap sequences. g Graph showing the percentage of change in fluorescence, based on lifetime measurements in DF substrates for different fluorophores and different linkers, with and without FEN1. pCy3 is linked to DNA via 3-carbon linker. Other fluorophores used are: Cy3B, nCy3, pCy5, Alexa Fluor 555, and Alexa Fluor 647. h Graph showing the percentage of Cy3 fluorescence change upon annealing of the substrate and addition of FEN1, when pCy3 is incorporated inside the ssDNA flap. The inset table lists the flap length, sequence, and fluorescence lifetimes. Error bars and ± represent standard deviation (SD) from three replicates. Oligo sequences are listed in Supplementary Table 1
Fig. 3
Fig. 3
The initial lifetime of Cy3-DNA sets up the stage for PIFE or PIFQ. a Schematic describing the effect of RPA binding to a pCy3-labeled oligo with different sequences and different fluorophore positions, leading to either quenching or to a fluorescence enhancement. b Fluorescence lifetimes of the 16 3′-pCy3-labeled oligo library with different sequences, either with RPA (blue) or without (gray). The dashed line shows the average fluorescence lifetime in the presence of RPA. The Pearson coefficient of the correlation between the initial fluorescence lifetime (in the absence of RPA) and the change in fluorescence (%) is reported with its standard error. c Library of 22 5′-pCy3-labeled oligos with their fluorescence lifetimes in the absence (gray) and presence (green) of RPA is shown (as described in b). The green vertical dashed line delimits oligos that show an overall PIFE effect, upon addition of RPA, whereas the red vertical dashed line delimits those showing an overall quenching effect. d Bar chart showing the fluorescence lifetimes of a library consisting of 15 internally pCy3-labeled oligos in the absence (gray) and the presence of RPA (purple). Horizontal dashed line, Pearson coefficient, green and red vertical dashed lines are as described in c. e Representation of the effect of the fluorophore type and position (six different positions with O-278 as 5′-labeled, O-279– > O-282 internally labeled and O-283 3′-labeled). The changes in fluorescence (%), upon the addition of RPA, are shown for the six oligos with different fluorophore types and linking chemistries (pCy3 in cyan, nCy3 in green, Cy3B in black, Alexa Fluor 555 in magenta, Alexa Fluor 647 in blue, pCy5 in red and DyLigth633 in orange). The horizontal dashed line represents the zero line. Fluorescence lifetime change (%) upon addition of gp2.5 (green), RPA (gray) or SSB (red) to oligos of 3′-pCy3-labeled library (f), 5′-pCy3-labeled library (g), and internal-pCy3-labeled library (h). The average final lifetimes upon protein additions are reported. Error bars represent SD from three replicates and ± represent standard error of the mean (SEM). Oligo sequences are listed in Supplementary Table 1
Fig. 4
Fig. 4
Insights into the structural properties of the DNA–Dye complexes. a Effect of viscosity on fluorescence; bar charts represent the fluorescence lifetimes of different fluorophores (free or DNA–Dye complexes), at increasing concentrations of glycerol (0–100%), in 10% increments. b Dependence of the fluorescence lifetime, without glycerol, on the viscosity resistance. The plot shows a linear dependence with slope of 0.44 ± 0.02 ns cP and y-intercept of 0.13 ± 0.04 ns. The horizontal error bars represent the standard error of the mean. The goodness of the linear fit, R2 value, is 0.989. c Fluorescence lifetimes of 11 internal-pCy3-labeled oligo library with different sequences (gray) and their corresponding dsDNA (red). The horizontal dashed line shows the average fluorescence lifetime of dsDNA in this library. The green vertical dashed line delimits oligos that show an overall NAIFE effect, upon annealing of their complementary strand, whereas the red vertical dashed line delimits those showing an overall NAIFQ effect. The Pearson coefficient of the correlation between the initial fluorescence lifetime (ssDNA) and the fluorescence change (%), upon annealing the complementary oligo, is reported with its respective standard error. d Fluorescence lifetime landscape of Cy3 compiling all the Cy3 lifetimes measured in this study (N = 398). The horizontal dashed line represents the median value of the landscape. e Bar chart indicating the fluorescence lifetime of O-328 and its derivatives, in ssDNA (gray) and dsDNA (black) forms, measured in RPA buffer. f Bar chart indicating the fluorescence lifetime of O-328 in ssDNA form, in different individual RPA buffer components. Error bars represent SD from three replicates and ± represent SEM. Oligo sequences are listed in Supplementary Table 1
Fig. 5
Fig. 5
PIFQ can be used at the single-molecule level to infer FEN1 catalytic kinetics. a smFRET cleavage assay used to follow the catalytic kinetics of FEN1 on DF-6,1 substrate. Top: schematic representation of the experimental approach. Bottom: representative single-molecule trace of a cleavage event showing the FRET change and the following loss of signal. The distribution of the time spent in bent state for N = 131 cleavage events was plotted and fitted with gamma distribution. The mean and standard error of the mean are reported. b Single-molecule cleavage assay (smPIFQ) with a single label (pCy3) placed at the tip of the flap. Top: schematic showing the design of the assay. Bottom: representative single-molecule trace monitoring the fluorescence quenching of pCy3 upon interaction with FEN1 and subsequent signal loss. The time spent in the quenched-state is quantified for N = 213 events and its distribution is plotted and fitted to an exponential decay, with the mean and standard error of the mean reported. c Representative smFRET trace showing the FRET change (highlighted in gray) and the total intensity change (highlighted in cyan) before the signal loss. The total intensity change corresponds to the quenching of the Cy3 signal. d Bar chart showing the reciprocal of the signal-to-noise ratio (1/SNR-shown in gray) and the absolute fractional change (AFC-shown in Cyan) (light blue) for smFRET and smPIFQ cleavage traces as described in SI Methods section. The error bars correspond to the standard errors of the mean (SEM) of the 1/SNR and AFC in each case. The analysis was performed using N = 100 traces in both cases. The p-value (p < 0.001) is calculated for estimating the statistical difference between 1/SNR and AFC using a two-sample t-test for both smFRET and smPIFQ cleavage traces. The inset table shows the p-values generated by the Kolmogorov–Smirnov (KS) test of normality for the four data sets. The KS test failed to reject the null hypothesis that the data is normally distributed as indicated by p > 0.05. Error bars represent SD of N = 100 traces and ± represent SEM. Measurements for ac were recorded with 50 ms temporal resolution
Fig. 6
Fig. 6
DNA structural changes monitored using Cy3 fluorescence modulation. a Secondary structure formation. Left: schematic showing the experimental set-up. Upon the addition of K+, a secondary structure is formed leading to an enhancement of Cy3 fluorescence. Middle: Cy3 fluorescence intensity histograms with (green) K+. The histograms are fitted to Gaussian distributions. Right: representative single-molecule trace showing the transitions to the enhanced-fluorescence state, upon formation of the secondary structure, as a result of the binding of K+. b Melting of the secondary structure. Left: schematic drawing showing the DNA construct used in c with a secondary structure formed in the presence of K+. However, upon addition of RPA, this secondary structure is melted, leading to the quenching of Cy3′s fluorescence. Middle: Intensity histograms of the Cy3 fluorescence, in the absence (green) and presence (blue) of RPA. Histograms are fitted with Gaussian distributions. Right: representative single-molecule trace showing the transitions to the quenched-fluorescence state, upon melting of the secondary structure induced by the binding of RPA measurements for a and b were recorded with 100 ms temporal resolution

References

    1. Hwang H, Myong S. Protein induced fluorescence enhancement (PIFE) for probing protein-nucleic acid interactions. Chem. Soc. Rev. 2014;43:1221–1229. doi: 10.1039/C3CS60201J. - DOI - PMC - PubMed
    1. Hwang H, Kim H, Myong S. Protein induced fluorescence enhancement as a single molecule assay with short distance sensitivity. Proc. Natl Acad. Sci. USA. 2011;108:7414–7418. doi: 10.1073/pnas.1017672108. - DOI - PMC - PubMed
    1. Ploetz E, et al. Forster resonance energy transfer and protein-induced fluorescence enhancement as synergetic multi-scale molecular rulers. Sci. Rep. 2016;6:33257. doi: 10.1038/srep33257. - DOI - PMC - PubMed
    1. Stennett EM, Ciuba MA, Lin S, Levitus M. Demystifying PIFE: The photophysics behind the protein-induced fluorescence enhancement phenomenon in Cy3. J. Phys. Chem. Lett. 2015;6:1819–1823. doi: 10.1021/acs.jpclett.5b00613. - DOI - PubMed
    1. Aramendia PF, Negri RM, Roman ES. Temperature dependence of fluorescence and photoisomerization in symmetric carbocyanines.influence of medium viscosity and molecular structure. J. Phys. Chem. 1994;98:3165–3173. doi: 10.1021/j100063a020. - DOI

Publication types

MeSH terms