. 2019 May;569(7756):418-422.
doi: 10.1038/s41586-019-1191-6. Epub 2019 May 8.

MicroRNA therapy stimulates uncontrolled cardiac repair after myocardial infarction in pigs

Affiliations

MicroRNA therapy stimulates uncontrolled cardiac repair after myocardial infarction in pigs

Khatia Gabisonia et al. Nature. 2019 May.

Abstract

Prompt coronary catheterization and revascularization have markedly improved the outcomes of myocardial infarction, but have also resulted in a growing number of surviving patients with permanent structural damage of the heart, which frequently leads to heart failure. There is an unmet clinical need for treatments for this condition1, particularly given the inability of cardiomyocytes to replicate and thereby regenerate the lost contractile tissue2. Here we show that expression of human microRNA-199a in infarcted pig hearts can stimulate cardiac repair. One month after myocardial infarction and delivery of this microRNA through an adeno-associated viral vector, treated animals showed marked improvements in both global and regional contractility, increased muscle mass and reduced scar size. These functional and morphological findings correlated with cardiomyocyte de-differentiation and proliferation. However, subsequent persistent and uncontrolled expression of the microRNA resulted in sudden arrhythmic death of most of the treated pigs. Such events were concurrent with myocardial infiltration of proliferating cells displaying a poorly differentiated myoblastic phenotype. These results show that achieving cardiac repair through the stimulation of endogenous cardiomyocyte proliferation is attainable in large mammals, however dosage of this therapy needs to be tightly controlled.


Conflict of interest statement

Competing interests. The authors declare no competing interests.

Figures

Extended Data Figure 1
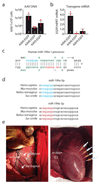
Extended Data Figure 1. Transduction of swine hearts after myocardial infarction with AAV vectors.
a-b, Adeno-associated virus serotype 6 (AAV6) is the most effective serotype for porcine heart transduction. The graphs show viral genomes (a) and EGFP mRNA (b) levels one month after direct intramyocardial injection of 1x10¹² v.g. particles of AAV6, AAV8 and AAV9 vectors carrying the EGFP transgene (these three AAV serotypes have been reported to transduce post-mitotic tissues at high efficiency - reviewed in ref. 28). Data are mean±SEM; the number of animals per group is indicated. c, Nucleotide sequence of the miR-199a-1 precursor. Mature miR-199a-5p and miR-199a-3p sequences are in green and their seed sequences are in blue and red respectively. d, Mature miR-199a-5p and miR-199a-3p sequences are conserved in human, mouse, rat and pig. The miRNA seed sequences are in blue for miR-199a-5p and in red for miR-199a-3p. e, Representative picture taken during porcine surgery and vector injection. After thoracotomy, the pericardial sac was opened, the LAD was exposed and occluded below its first branch for 90 minutes. Ten minutes after reperfusion, AAV6-Control or AAV6-miR-199a were injected into the infarct border zone.
Extended Data Figure 2
Extended Data Figure 2. Systematic assessment of miR-199a-3p expression after AAV6-mediated transduction.
a, Schematic representation of pig heart sectioning for histological and molecular studies. After arrest in diastole, the heart was excised and the pericardial sac removed. AAV injection sites, which were marked with coloured epicardial sutures during surgery, were further traced with a green water-proof paint. Four 1-cm thick transversal slices were cut starting from the base to the apex (1 to 4 in the Figure). Each slice was subsequently divided into 2-8 regions, each one labelled with a capital letter, and then into additional sub-regions (letters plus numbers) for targeted molecular and histological analyses. Sectors H, T and C corresponded to the infarct border zone (BZ), where the vectors were administered, while sector L was considered representative of the remote zone. b, Injection and infarct border segments for each slice were divided into smaller fragments (dashed lines) to accurately assess the levels of expression of the transgene at 12 days after transduction. The syringe indicates the injection sites. c, For each slice and segment, the graphs show real-time PCR quantifications of the mature miR-199a-3p expressed as fold over endogenous levels (AAV6-Control). One representative animal is shown out of four analysed in the same systematic manner, with comparable results. d, In situ hybridisation of pig heart sections for the detection of miR-199a expression at the single cell level. Each of sectors indicated in panel b was tested by in situ hybridisation using locked nucleic acid (LNA) probes detecting miR-199a-3p or U6 snRNA, or a probe with the same nucleotide composition as the one against miR-199a-3p but with a scrambled sequence (scramble). Expression of miR-199a-3p was robust in cardiomyocytes and specific for the injected areas throughout the left ventricle. One representative animal is shown out of four analysed in the same systematic manner with comparable results. Scale bar: 100 µm
Extended Data Figure 3
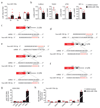
Extended Data Figure 3. Downregulation of miR-199a target genes in transduced heart tissue and organ distribution of the AAV6-miR-199a vector.
a, Real-time PCR quantification of both strands of miR-199a in AAV6-Control- and AAV6-miR-199a-injected pig hearts (n=4 and n=10 respectively) normalized over endogenous 5S rRNA. Data are mean±SEM. b, mRNA levels of predicted and annotated target genes of miR-199a in AAV6-Control- and AAV6-miR-199a-treated pig hearts (n=4 per group) one month after MI and viral transduction. Data are mean±SEM; *P<0.05 vs. AAV6-Control; t-test, two-sided. c-e, Predicted target sites of miR-199a-3p in the 3'UTR sequences of swine Cofilin2, TAOK1 and βTRC according to TargetScan Release 7.2. All these three genes are verified direct targets of this miRNA in rodents; the corresponding 3'UTR target sites for Cofilin2 and TAOK1 are conserved in swine; for βTRC, two alternative target sites are in swine are shown. Other miR-199a-3p target genes originally identified in mice (in particular, Homer1 and Clic5 11,29) are not conserved in the swine genome. In the pig genome, βTRC also has an additional predicted target sequence for miR-199a-5p, which is indicated. f. Predicted target site of miR-199a-5p in the 3’UTR of pig HIF-1α mRNA. g, Quantification of viral genomes in the indicated organs one month after intracardiac injection of AAV6-miR199a. Data are expressed as fold over liver levels after normalization for cellular DNA content using the 18S DNA as a reference (mean±SEM, n=4 per group). The levels of viral DNA in myocardium of the injected animals were >18 times higher than in liver and >40 times higher than in other organs (spleen, kidney and lung). h, Levels of miR-199a-3p RNA in the indicated organs one month after intracardiac injection of AAV6-miR-199a. Data are shown as fold over endogenous miRNA levels in liver in control animals after normalization for cellular 5S rRNA (n=4 per group). Data are mean±SEM. The amount of hsa-miR-199a-3p RNA was not elevated in any analysed organ, except for the heart. No overt signs of pathology, including hyper-proliferation (assessed by Ki67 staining) were observed.
Extended Data Figure 4
Extended Data Figure 4. MiR-199a improves global heart function and decreases infarct mass one month after treatment.
a, Graphs showing percent changes in infarct mass, infarct mass over LV mass and EF, as indicated, between 2 and 28 days after MI and AAV6-Control or AAV6-miR-199a delivery, measured by cMRI. The number of analysed animals were 7 and 8, 7 and 8, 7 and 9 for infarct mass, infarct mass over LV mass and EF for the two groups, respectively. Upper panels: cumulative values for all pigs. Data are mean±SEM; *P<0.05; t-test, two tailed; lower panels: data from individual pigs. b, Infarct healing at one month after AAV6-miR-199a injection. The LGE-cMRI images (from apex to base, a to e) are the same as in Fig. 1h without red counterstain. The red arrow shows the infarcted area in the central plane. c, Gross anatomy of cardiac slices with corresponding LGE-cMRI images in representative AAV6-Control and AAV6-miR-199a treated pig hearts, at 28 days post-MI. d, Heart rate in sham and infarcted animals injected with AAV6-Control and AAV6-miR-199a at one month after treatment. Data are mean±SEM; the number of animals per group and time point are indicated.
Extended Data Figure 5
Extended Data Figure 5. AAV6-miR-199a induces cardiomyocyte proliferation in vivo.
a, Representative images of Ki67 and α-actinin immunofluorescence staining of the infarct border (sector H) or remote (sector L) zones of AAV6-Control- and AAV6-miR-199a-treated animals (n=4 and n=6, respectively; analysis is from at least 7 high-resolution images acquired from at least 8 different regions of each heart), 12 days post MI. Scale bar: 100 µm. At least 6 treated. b, High magnification representative images of phospho-histone H3 immunostaining in the infarct border zones of four different pigs treated with AAV6-miR-199a, 12 days post MI. Scale bar: 100 µm.
Extended Data Figure 6
Extended Data Figure 6. Multinucleation and CM hypertrophy in miR-199a-treated pig hearts.
a, Representative images of longitudinal sections stained with wheat germ agglutinin (WGA) to assess the number of nuclei per CM in the infarct border zone of AAV6-Control- and AAV6-miR-199a-treated animals (n=4 and n=6, respectively; analysis is from at least 7 high-resolution images acquired from at least 8 different regions of each heart), 12 days post MI. The right panels show the estimated number of nuclei for each cardiomyocyte. Scale bar: 50 µm. b, Additional representative images of mono- or bi-nucleated BrdU-positive CMs in the infarct border zone of AAV6-Control- and AAV6-miR-199a-treated animals, 12 days post MI. Scale bar: 50 µm. c, Cross-sectional area measurements of BrdU+ and BrdU- cardiomyocytes in AAV6-Control- and AAV6-miR-199a-treated pigs 12 days after surgery. Data are mean±SEM from the analysis of 4 pigs. d, Representative images of BrdU+ and BrdU- CM. Scale bar: 50 µm. The right panels are high magnification images of the indicated portions of the left images.
Extended Data Figure 7
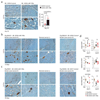
Extended Data Figure 7. Expression of GATA4 in cardiomyocytes in the infarct border zone of AAV6-miR-199a-treated pigs.
a, Representative immunohistochemistry images of GATA4-positive cells in AAV6-Control- and AAV6-miR-199a-injected pigs, 30 days after treatment. The bottom panels are high magnification images of the indicated portions of the upper images. The graph on the right shows quantification of cells showing GATA4 cytoplasmic localization. Data are mean±SEM; the number of animals per group is indicated. Quantification is from at least 7 high-resolution images acquired from at least 8 different regions of each heart. *P<0.05; t-test, two sides. Scale bar: 100 µm. b-c. Additional low and high magnification representative immunohistochemistry images of GATA4-positive cells in the infarct border (sector H) or remote zone (sector L) of AAV6-Control- and AAV6-miR-199a-injected pigs, 12 days (b) and 30 days (c) after treatment. Scale bar: 100 µm. d, AAV6-miR-199a treatment does not alter the levels of DAB2, SMARCA5 and DESTRIN mRNAs. The graphs show real-time PCR quantifications of the levels of the indicated genes in sham, AAV6-Control- and AAV6-miR-199a-injected pig hearts, at 12 and 30 days after surgery; n=3 per group. Data are mean±SEM; the number of animals per group and time point is indicated. ns: not significant; *P<0.05 vs. AAV6-Control at the same time point, t-test, two-sided.
Extended Data Figure 8
Extended Data Figure 8. Molecular correlates of miR-199a transduction.
a, Real-time PCR quantification of the ratio between α- and β-myosin heavy chain mRNA in sham, AAV6-Control- and AAV6-miR-199a-injected pig hearts, at 12 and 30 days after surgery in the H (border zone) and L (remote zone) cardiac sectors. Data are mean±SEM; the number of animals per group and time point is indicated. ns: not significant; *P<0.05 vs. AAV6-Control at the same time point; two-way ANOVA with Bonferroni post-hoc. b,c, Lectin immunofluorescence images (b) of sham, AAV6-Control- and AAV6-miR-199a-treated pig sections, 30 days after MI and vector administration along with quantification (c) of CM cross-sectional area (μm2). Data are mean±SEM; the number of analysed animals is indicated. ns: not significant. One-way ANOVA with Bonferroni post-hoc. Scale bar: 50 µm. d, Low and high magnification (insets) representative images of infarcted hearts injected with AAV6-Control or AAV6-miR-199a after immunohistochemistry to detect desmin (which is essential for maintaining structural and functional integrity of myocytes and was expressed at normally high levels), myogenin (which coordinates skeletal myogenesis and repair and was not expressed), endothelin-B receptor (which selectively stained arterioles smooth muscle cells) and Wilms' tumour protein 1 (Wt1, which was expressed at low levels in the vascular endothelium, but not in myocytes). Analysis was performed in at least 7 high-resolution images acquired from at least 8 different regions of the heart of 3 pigs per group. Scale bar: 100 µm. e, Real-time PCR quantification of the levels of ANP and BNP in sham, AAV6-Control- and AAV6-miR-199a-injected pig hearts, at 12 and 30 days after surgery. Data are mean±SEM; the number of animals per group and time point is indicated. ns: not significant; *P<0.05 vs. AAV6-Control at the same time point. One-way ANOVA with Bonferroni post-hoc. f, Representative sections of pig hearts treated with AAV6-Control and AAV6-miR-199a at day 30 after infarction and vector injection stained with FITC-lectin to visualize vessels and with an anti-α-SMA antibody to detect smooth muscle cells, along with quantification of lectin-positive vessels. No significant difference between the two MI groups was detected in capillary density at either 12 or 30 days. Data are mean±SEM; the number of animals per group is indicated. Analysis was performed in at least 7 high-resolution images acquired from at least 8 different regions of the heart. *P<0.05. t-test, two-sided. Scale bar: 100 µm.
Extended Data Figure 9
Extended Data Figure 9. Long-term expression of miR-199a induces progressive cardiac regeneration.
a, The LGE-cMRI images (from apex to base, a to e) are the same as in Fig. 4a without red counterstain. The red arrow shows the infarcted area in the central plane c. b, cMRI images from a pig sacrificed at week 8 after MI and AAV6-miR-199a treatment. The upper panels show serial images from apex to base at day 2, week 4 and week 8; the infarct area is counterstained in red. The bottom panels show the same images without counterstaining. The green arrow shows the pacemaker lead attachment site. c, Gross anatomy of cardiac slices of the pig shown in panel b at sacrifice. The syringe indicates the injected area. The green arrow shows the pacemaker lead attachment site. Similar cardiac repair results were observed in three pigs treated with miR-199a that survived 2 months after treatment.
Extended Data Figure 10
Extended Data Figure 10. Recording of fatal arrhythmias in two infarcted pigs treated with AAV6-miR-199a-3p.
Initiation of ventricular fibrillation recorded at the moment of death in two AAV6-miR-199a pigs by implanted miniaturized ECG recorders (Reveal, Medtronic, 9529). a, A premature ventricular ectopic beat (red arrow) with a coupling interval of 380 ms during a slowing heart rhythm induced a fast ventricular tachycardia that degenerated in ventricular fibrillation. b, A premature ventricular ectopic beat (red arrow) with coupling interval of 350 ms induced a fast ventricular tachycardia that quickly degenerated in ventricular fibrillation of different amplitudes resembling polymorphic ventricular tachycardia. c. AAV6-mediated, long-term expression of miR-199a did not affect the expression levels of ion channels or associated proteins involved in known arrhythmogenic conditions. In the infarct border zone of pigs treated with AAV6-Control or AAV6-miR-199a (n=6 and n=4 respectively) at 30 days after transduction, the expression levels of genes known to be involved in the pathogenesis of the Long QT Syndrome (Scn5a, Kcne1, Snta1, Akap9, Ank2), Brugada syndrome (Cacna1, Cacnb2, Scn1b), Carvajal syndrome (DSP), Arrhythmogenic Right Ventricular Cardiomyopathy (DSG2, DSP), Catecholaminergic Polymorphic Ventricular Tachycardia (CASQ2, Ryr2) were assessed. Additional investigated mRNAs were those coding for Serca2A (which also served as a positive control since it is depressed during heart failure and was found increased in miR-199a-treated animals), phospholamban (Pln), Connexins 40 and 43 (CX40 and CX43 respectively). The miR-199a-treated pigs in which analysis was performed included one pig that survived at 8 weeks (pig 50) and three pigs with sudden death at 7 weeks (pigs 55, 66 and 67). Data are mean±SEM. ns: not significant; *P<0.05 vs. AAV6-Control. t-test, two sided.
Extended Data Figure 11
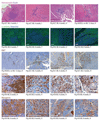
Extended Data Figure 11. miR-199a induces formation of proliferating cell clusters with an early myoblast phenotype infiltrating the pig myocardium.
Additional images of cell clusters infiltrating the infarcted hearts injected with AAV6-miR-199a after hematoxylin-eosin staining or immunostaining to detect the indicated antigens. These cells scored negative for the leukocyte common antigen CD45 and for CD34 (excluding their immune, hematopoietic or endothelial origin) and were highly proliferating, as inferred from virtually complete positivity for Ki67. These cells also scored negative for markers of muscle differentiation, including desmin (identifying myogenic cells of cardiac, smooth and striated muscle), sarcomeric α-actinin (which labels Z lines in the cardiac and skeletal muscle sarcomere) and HHF35 (a monoclonal antibody recognizing muscle-specific α- and γ-actin); cells were also negative for Wt1 (marking several malignancies and the epicardium). The infiltrating cells were positive for GATA4 (which is critical for proper mammalian cardiac development) and myogenin (the reactivation of which characterizes rhabdomyosarcoma cells) as well as the calmodulin-binding protein caldesmon (which regulates smooth muscle contraction and is expressed at high levels in leiomyoma and leiomyosarcoma) and the endothelin-B receptor, normally expressed in smooth muscle cells. The pig identity, treatment, time of analysis and cardiac sector from which the sample was taken are shown for each picture. Scale bar: 100 µm. Clusters of cells were never detected in control-injected animals, however in one animal injected with AAV6-miR-199a in the absence of MI.
Figure 1
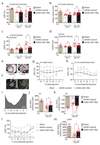
Figure 1. miR-199a treatment reduces infarct size.
a, Experimental protocol. b, Graph representing miR-199a-3p quantification 12 and 28 days after infarction and vector delivery. Data are represented as fold over endogenous levels (AAV6-Control) and expressed as mean±SEM; the number of animals per group and time point is indicated. **P<0.01 vs. AAV6-Control at the same time point; ##P<0.01 vs. sham; two-way ANOVA with Bonferroni post-hoc. c, In situ hybridisation of miR-199a-3p, scrambled oligonucleotide and U6 LNA probes in pig heart sections at day 12 after treatment. Scale bar: 100 µm. Analysis was performed in 8 different sectors of at least 5 animals per group as shown in Extended Data Fig. 2d. d, Examples of T2-weighted cMRI images showing cardiac oedema (a), with corresponding late gadolinium enhancement (LGE) cMRI images (b) at day 2 post-MI. Dark myocardium is viable, infarcted area is highlighted in red for better visualization. The number of analysed animals is indicated in panel e. e, Oedema (%LV) at two days after MI. Data are mean±SEM. ns: not significant; t-test, two-sided. f, LGE mass (g) and size (%LV), at days 2 and 28 post-MI. Data are mean±SEM. ns: not significant; *P<0.05 vs. AAV6-Control at the same time point; #P<0.05 vs. AAV6-miR-199a at day 2 post MI; two-way ANOVA with Bonferroni post-hoc. g, Schematic representation of cMRI slices, from apex to base (a to e). h, LGE-cMRI images (from apex to base, a to e) of four representative pig hearts, two receiving AAV6-Control and other two AAV6-miR-199a at 2 and 28 days after MI. The infarct area is counterstained in red; the corresponding original images without counterstaining are shown in Extended Data Fig. 4b. The number of analysed animals is indicated in panel f. i-j, Masson’s trichrome staining representative images of transverse heart sections of three treated and control pig hearts one month after surgery (i), with relative quantification of the area of fibrosis (j). Quantification is from at least 8 different regions of each heart, 8 animals per group. Data are mean±SEM. *P<0.05. t-test, two-sided. BZ: border zone. k, Identification of infarct scar and grey zone by LGE-cMRI. The number of analysed animals is indicated in panel l. l, Infarct grey zone, infarct core and their ratio 28 days post-MI measured by LGE-cMRI. Data are mean±SEM. ns: not significant; *P<0.05 vs. AAV6-Control at the same time point; t-test, two-sided.
Figure 2
Figure 2. miR-199a delivery improves global and regional cardiac function.
a-d, LV ejection fraction (EF, %), stroke volume (ml), LV end-systolic volume (ml) and LV end-diastolic volume (ml) measured by cMRI in non-infarcted controls and infarcted animals at days 2 and 28 post-MI and either AAV6-Control or AAV6-miR-199a injection. Data are mean±SEM; the number of animals per group and time point is indicated. ns: not significant; *P<0.05 vs. AAV6-Control at the same time point; #P<0.05 vs. sham; $P<0.05 vs. day 2; two-way ANOVA with Bonferroni post-hoc. e, Example of cardiac short axis image with the tagging grid in diastole and systole. f, Subdivision of the LV short axis in 8 circumferential segments (left) and their correspondence with the infarct core, border zone and the remote zone (right). The syringe indicates the infarct border injected with AAVs. IS, inferoseptal; S, septal, AS, anteroseptal; A, anterior; AL, anterolateral; L, lateral; IL, inferolateral; I, inferior. g, h, Eight-segment curves corresponding to LV radial (LVErr) (g) and circumferential (LVEcc) (h) strain at 28 days after MI. Data are mean±SEM. *P<0.05 vs. AAV6-Control; #P<0.05 vs. sham; two-way ANOVA with Bonferroni post-hoc. The number of animals for the analysis is indicated in panels j and k. i, Schematic example of calculation of the area under curve (AUC) in arbitrary units. j, k, AUC for Err (j) and Ecc (k). Data are mean±SEM; the number of animals per group is indicated. *P<0.05 vs. AAV6-Control; #P<0.05 vs. sham; one-way ANOVA with Bonferroni post-hoc. l, Eight-segment curves corresponding to LV end-systolic wall thickening (LVWT) at 28 days after MI. Data are mean±SEM. *P<0.05 vs. AAV6-Control; #P<0.05 vs. sham; two-way ANOVA with Bonferroni post-hoc. The number of analysed animals is shown in panel m. m, AUC for LVWT. Data are mean±SEM; the number of animals per group is indicated. *P<0.05 vs. AAV6-Control; #P<0.05 vs. sham; one-way ANOVA with Bonferroni post-hoc.
Figure 3
Figure 3. AAV6-miR-199a administration induces cardiomyocyte proliferation.
a, Schematic representation of the protocol for BrdU administration. b, Representative Ki67 immunohistochemistry images of the infarct border zone (BZ) 12 days after surgery, and relative quantification. The bottom panels are high magnification images of the indicated portions of the upper images. Data are mean±SEM; the number of animals per group is indicated. *P<0.05; t-test, two-sided. Scale bar: 100 µm. c, d, Representative images of BrdU (c) and phospho-histone H3 (d) immunostaining in the infarct border zone 12 days post MI, with relative quantifications. The bottom panels are high magnification images of the indicated portion of the upper image. Data are mean±SEM; the number of animals per group is indicated. *P<0.05; t-test, two-sided. Scale bar: 100 µm. e, Aurora B immunofluorescence images showing localization in midbodies (arrow) in AAV6-miR-199a treated animals, 12 days post MI. Scale bar: 20 µm. f, Distribution of the number of total and BrdU+ nuclei per CM in AAV6-Control- and AAV6-miR-199a-treated pigs 12 days after surgery. Data are mean±SEM of four pigs with at least 8 sections analysed per pig. g, Representative images of multinucleated CMs with BrdU+ nuclei. WGA: wheat germ agglutinin to stain CM sarcolemma. Scale bar: 100 µm. h, Connexin-43 (CX43, red) and phospho-histone H3 (pH3, blue-green) immunofluorescence representative images of AAV6-miR-199a-treated pig heart sections, 12 days after infarction. Scale bar: 100 µm. i, Representative immunohistochemistry images of GATA4-positive cells in AAV6-Control- and AAV6-miR-199a-injected pigs, 12 days after treatment. The bottom panels are high magnification images of the indicated portions of the upper images. j, quantification of cells showing GATA4 cytoplasmic localization. Data are mean±SEM; the number of animals per group is indicated. Quantification is from at least 7 high-resolution images acquired from at least 8 different regions of each heart. *P<0.05; t-test, two-sided. Scale bar: 100 µm.
Figure 4
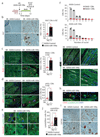
Figure 4. Long-term expression of miR-199a induces progressive cardiac regeneration but causes sudden death.
a, LGE-cMRI representative images, from apex to base, of one AAV6-Control and one AAV6-miR-199a-treated pig heart at 1, 4 and 8 weeks after MI. The infarct area is counterstained in red; the corresponding original images without counterstaining are shown in Extended Data Fig. 9a. Similar cardiac repair results were observed in three pigs treated with miR-199a that survived 2 months after treatment. b, Kaplan Meier curve (log-rank test) showing mortality after MI and vector administration. The number of animals per group is indicated. c, Hematoxylin-eosin staining or immunostaining for the indicated antigens of the same cell cluster in consecutive tissue sections from an infarcted heart injected with AAV6-miR-199a at 8 weeks after treatment. Scale bar: 100 µm. d, In situ hybridisation of miR-199a-3p, scrambled and U6 LNA probes in pig heart sections with infiltrating cell cluster. Scale bar: 100 µm.

Comment in

References

    1. Roth GA, et al. Global, Regional, and National Burden of Cardiovascular Diseases for 10 Causes, 1990 to 2015. J Am Coll Cardiol. 2017;70:1–25. - PMC - PubMed
    1. Eschenhagen T, et al. Cardiomyocyte Regeneration: A Consensus Statement. Circulation. 2017;136:680–686. - PMC - PubMed
    1. Porrello ER, et al. Transient regenerative potential of the neonatal mouse heart. Science. 2011;331:1078–1080. - PMC - PubMed
    1. Oberpriller JO, Oberpriller JC. Response of the adult newt ventricle to injury. J Exp Zool. 1974;187:249–253. - PubMed
    1. Poss KD, Wilson LG, Keating MT. Heart regeneration in zebrafish. Science. 2002;298:2188–2190. - PubMed

Publication types