. 2019 May;25(5):792-804.
doi: 10.1038/s41591-019-0414-6. Epub 2019 May 8.

A longitudinal big data approach for precision health

Affiliations

A longitudinal big data approach for precision health

Sophia Miryam Schüssler-Fiorenza Rose et al. Nat Med. 2019 May.

Abstract

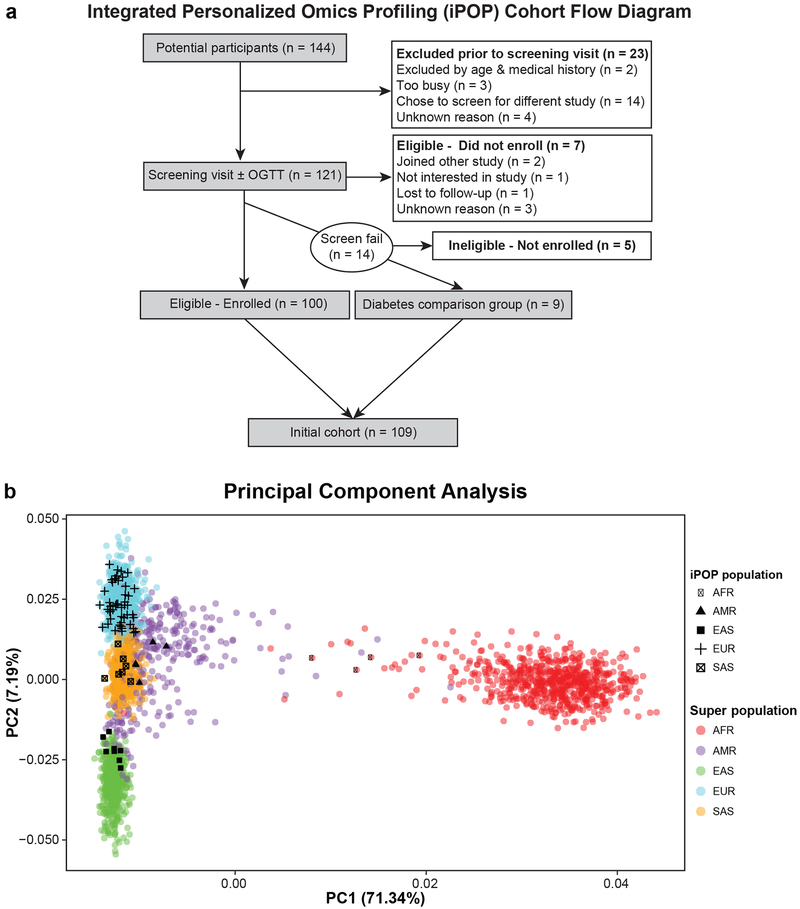
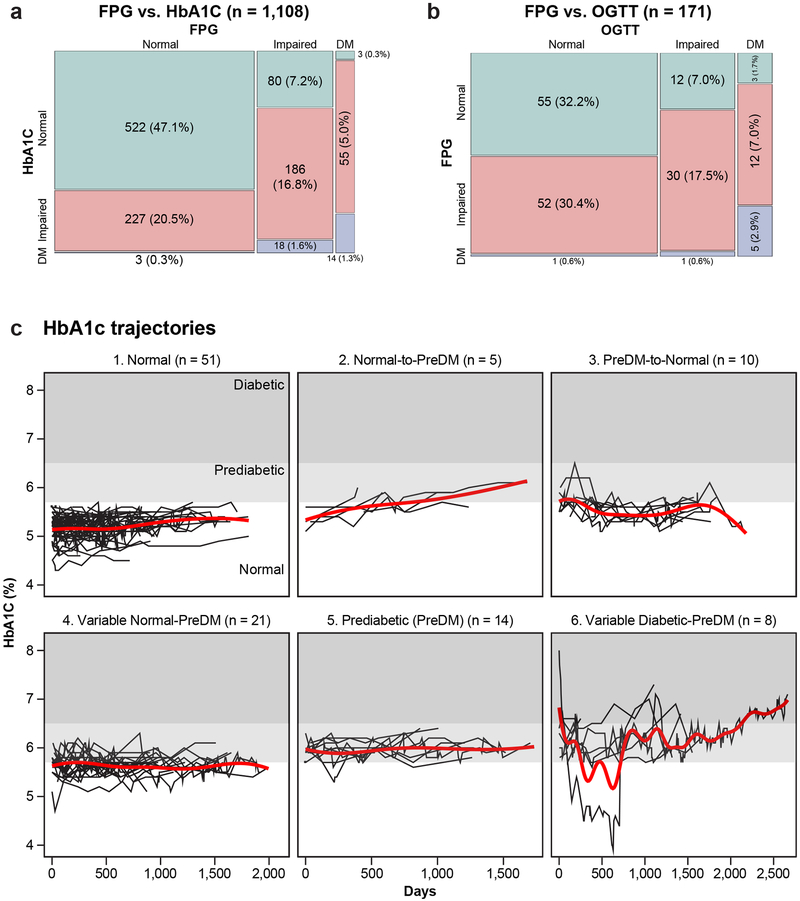
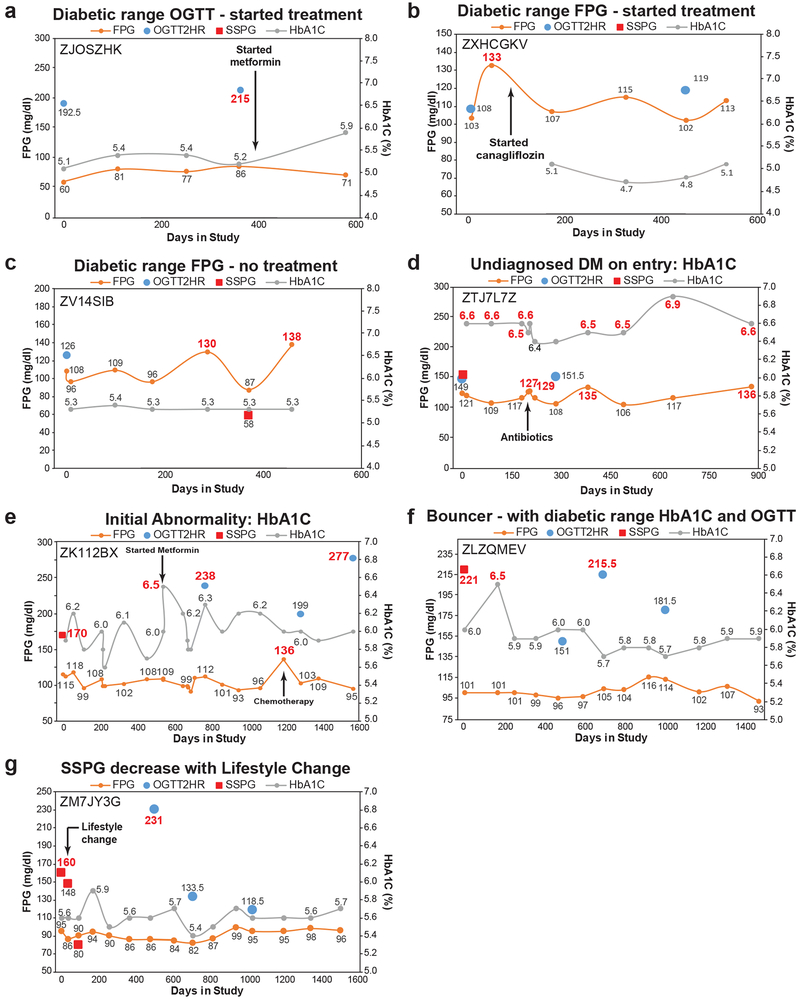
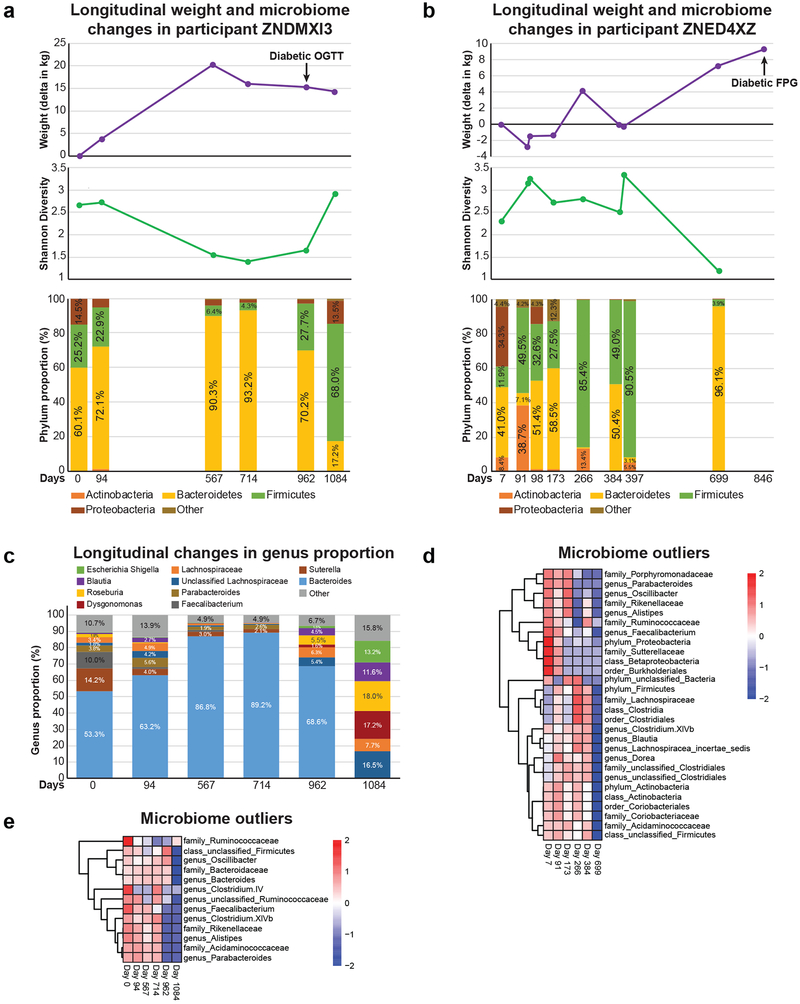
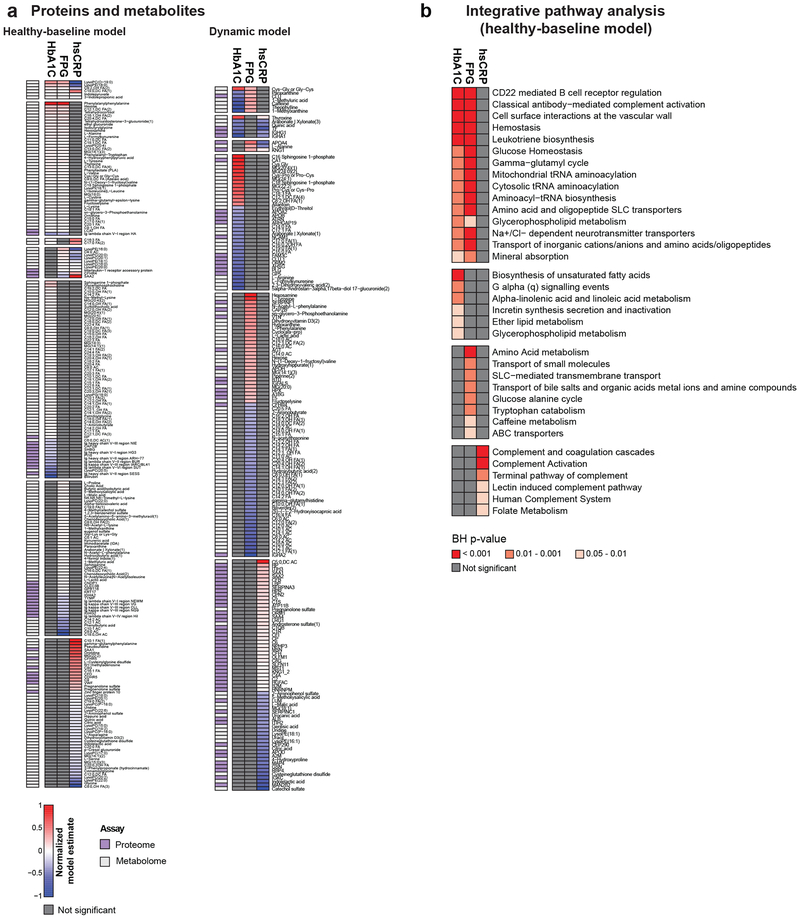
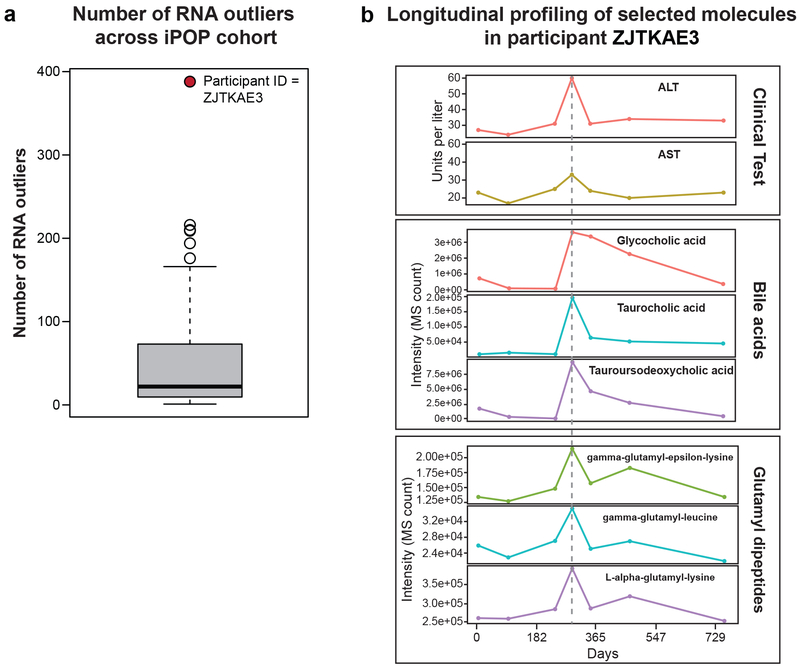
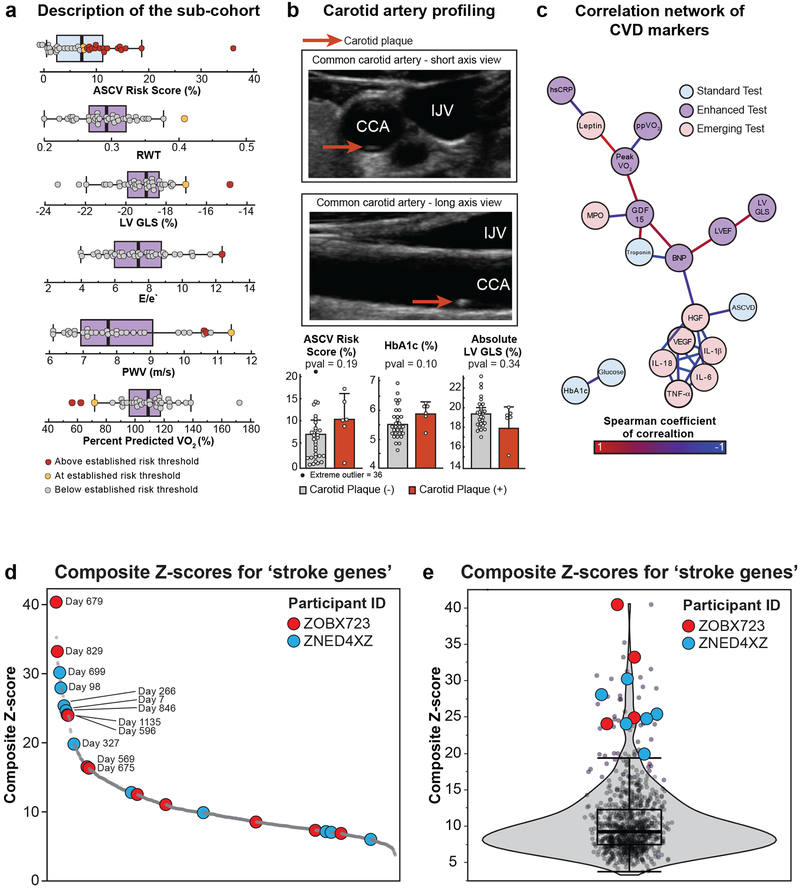
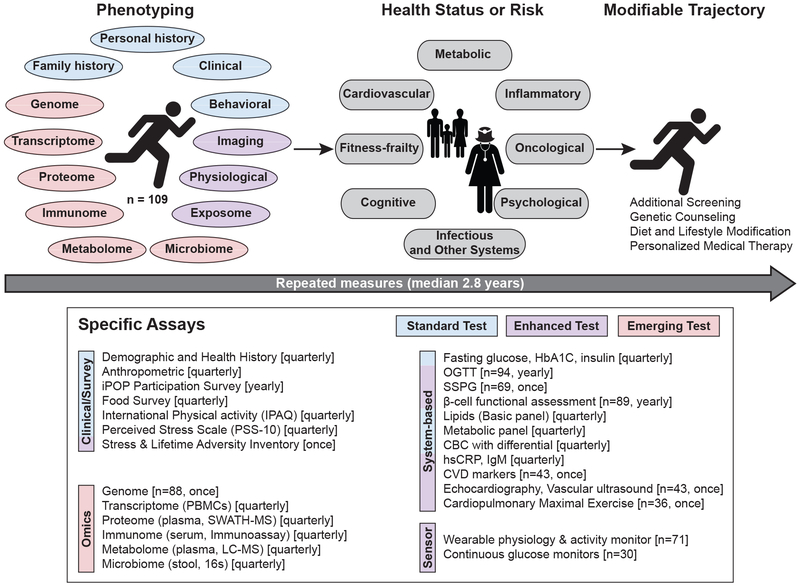
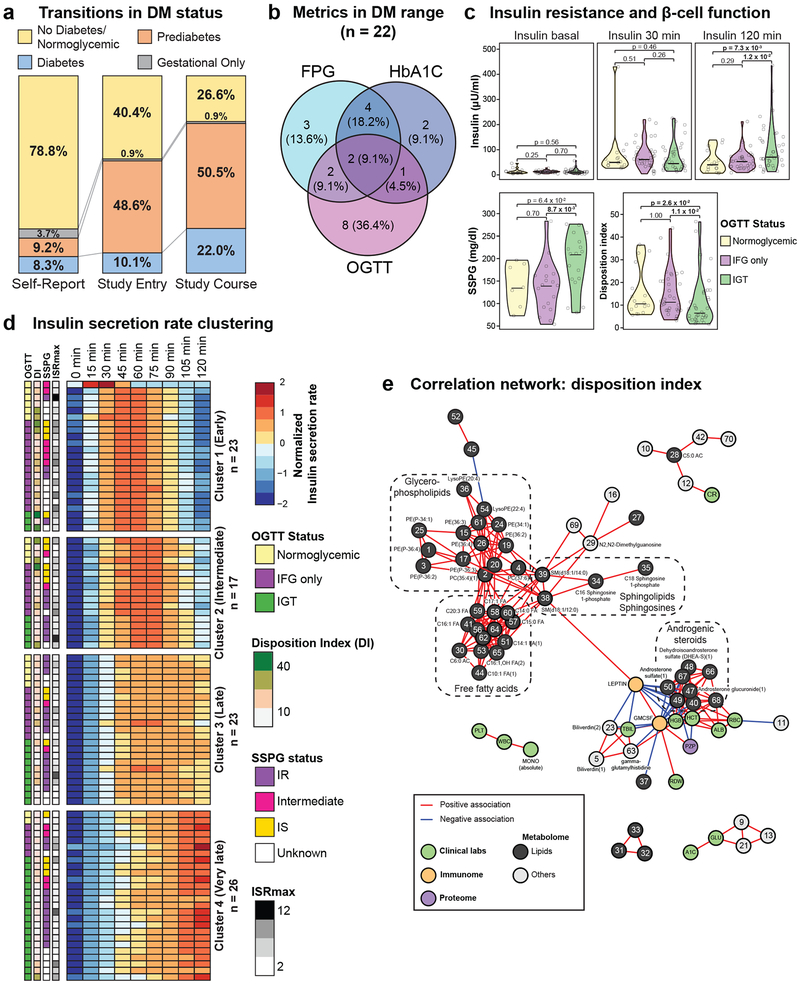
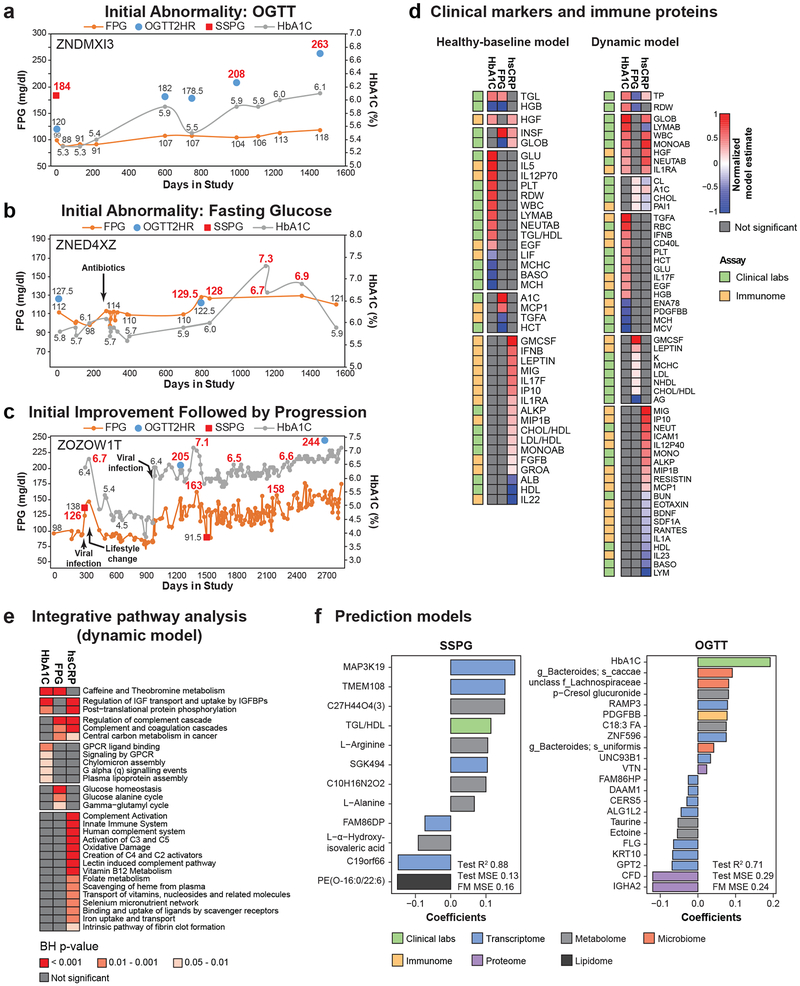
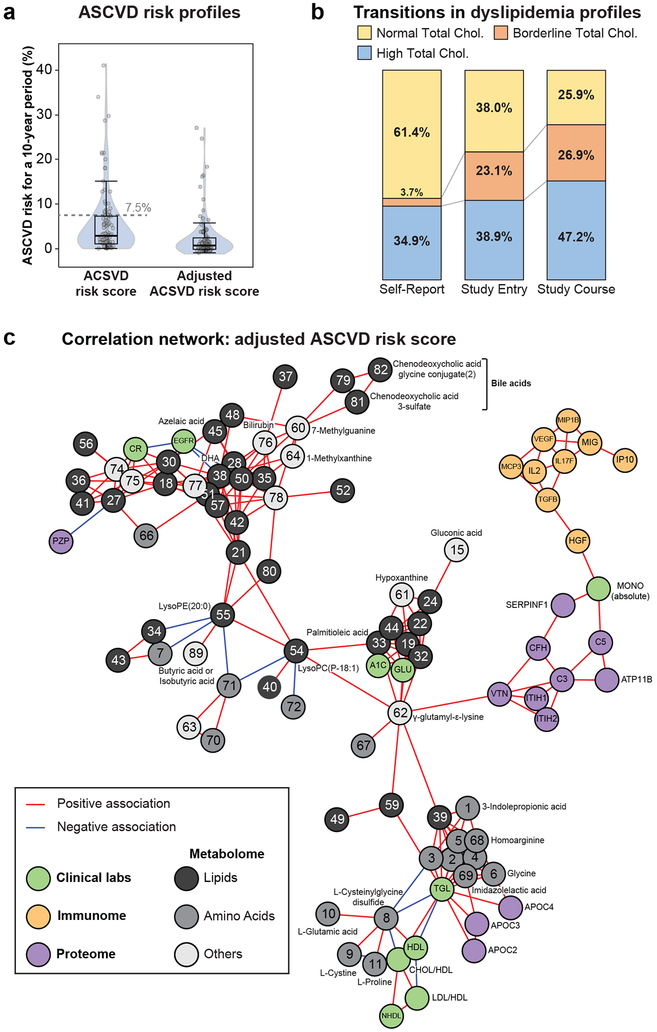
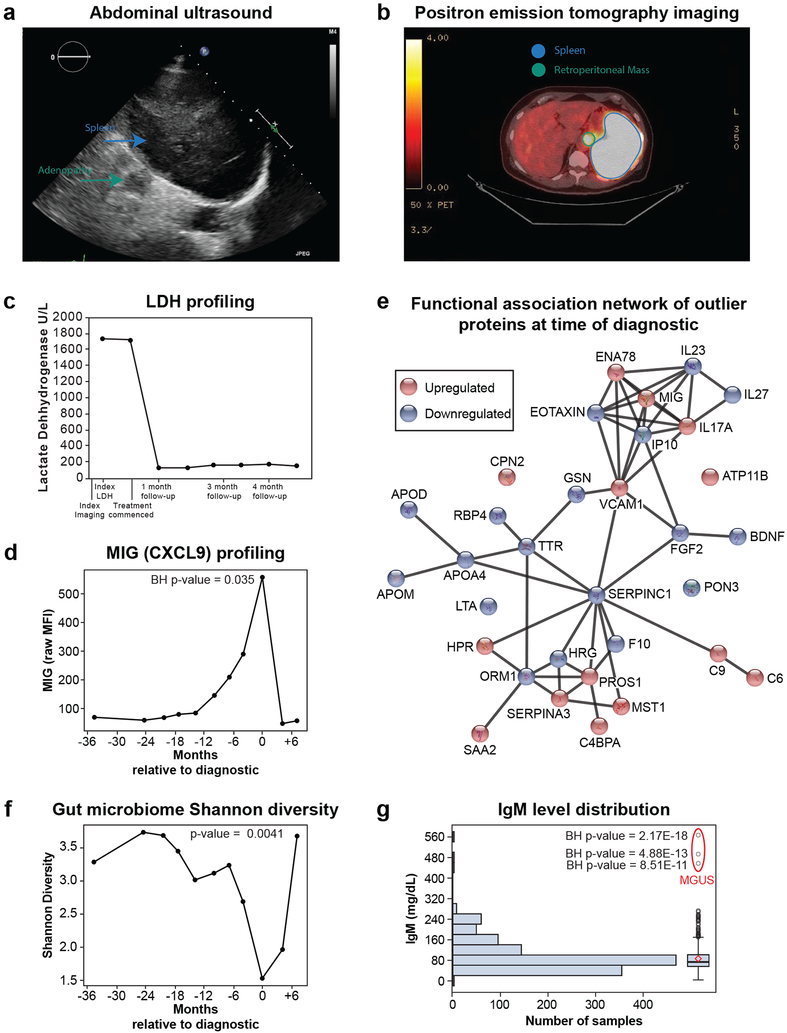
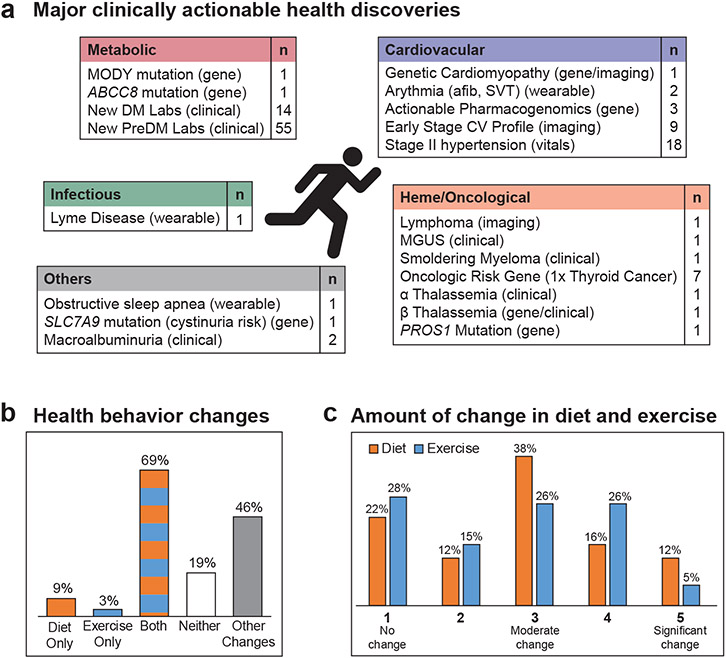
Precision health relies on the ability to assess disease risk at an individual level, detect early preclinical conditions and initiate preventive strategies. Recent technological advances in omics and wearable monitoring enable deep molecular and physiological profiling and may provide important tools for precision health. We explored the ability of deep longitudinal profiling to make health-related discoveries, identify clinically relevant molecular pathways and affect behavior in a prospective longitudinal cohort (n = 109) enriched for risk of type 2 diabetes mellitus. The cohort underwent integrative personalized omics profiling from samples collected quarterly for up to 8 years (median, 2.8 years) using clinical measures and emerging technologies including genome, immunome, transcriptome, proteome, metabolome, microbiome and wearable monitoring. We discovered more than 67 clinically actionable health discoveries and identified multiple molecular pathways associated with metabolic, cardiovascular and oncologic pathophysiology. We developed prediction models for insulin resistance by using omics measurements, illustrating their potential to replace burdensome tests. Finally, study participation led the majority of participants to implement diet and exercise changes. Altogether, we conclude that deep longitudinal profiling can lead to actionable health discoveries and provide relevant information for precision health.


Figures

Extended Data Fig 1.
Extended Data Fig 1.. Integrated personalized omics profiling cohort flow chart and genetic ancestry.
(a) The flow chart demonstrates recruitment and enrollment of the iPOP cohort. (b) Principal components analysis (PCA) plot showing the ancestries of 72 participants. The reference includes 2,504 samples from the 1000 Genomes Project. Each filled circle is a 1000GP sample, colored by the super-population of ancestral origin, namely African (AFR; red), admixed American (AMR; purple), East Asian (EAS; green), European (EUR; cyan) and South Asian (SAS; orange). Each black symbol is an individual from the study, which we categorized by self-reported ethnicity consistent with the 1000GP super-population definitions, namely AFR (black filled circle), AMR (black filled triangle), EAS (black filled square), EUR (black plus sign) and SAS (a checked box). We see that the individuals in our study have self-reported ancestries generally clustering within the super-population reference panel from the 1000GP.
Extended Data Fig 2.
Extended Data Fig 2.. Comparison of diabetic metrics in categorizing individuals when performed at the same time and HbA1C trajectories.
(a) Overlap of Fasting Plasma Glucose (FPG) and Hemoglobin A1C (HbA1C) categories when simultaneously measured. FPG impaired: 100 mg/dL ≤ FPG < 126 mg/dL; diabetic range: FPG ≥ 126 mg/dL; HbA1C impaired: 5.7% ≤ HbA1C < 6.5%; diabetic range: HbA1C ≥ 6.5%. (b) Overlap of FPG and 2-Hour Oral Glucose Tolerance Test (OGTT) when simultaneously measured. FPG ranges as above. OGTT impaired: 140 mg/dL ≤ OGTT < 200 mg/dL; diabetic range ≥ 200 mg/dL. (c) Longitudinal patterns of changes in Hemoglobin A1C (HbA1C) over time. Six different patterns could be characterized including: 1- participants who remained in the normal range the entire study (Group 1, n = 51), 2- participants who progressed from normal to prediabetic (Group 2, n = 5), 3- participants who went from prediabetic to normal (Group 3, n = 10), 4- participants whose HbA1C went back and forth from normal to prediabetic (Group 4, n = 21), 5- participants whose HbA1C labs were predominantly in the prediabetic range (Group 5, n = 14), and 6- participants whose HbA1C crossed into the diabetic range (Group 6, n = 8). The red lines represent the overall penalized b-spline of participants’ data in each category.
Extended Data Fig 3.
Extended Data Fig 3.. Additional individual longitudinal trajectories for diabetic measures.
Diabetic-range metrics are indicated in red. (a) Diabetic range OGTT, (b,c) Diabetic range FPG, (d) undiagnosed DM at study entry (HbA1C), (e) Initial abnormality HbA1C. Note this person had two HbA1C measurements on the same day at two different laboratories and was started on medication based on the higher measurement, (f) Bouncer with diabetic range HbA1C and OGTT, and (g) SSPG decrease with lifestyle change.
Extended Data Fig 4.
Extended Data Fig 4.. Longitudinal microbiome trajectories in diabetes.
Longitudinal weight, gut microbial Shannon diversity and phylum proportion changes in participants (a) ZNDMXI3 and (b) ZNED4XZ. (c) Longitudinal changes in genus proportion (ZNDMXI3). Microbiome outliers (95th percentile) at the latest microbiome sample time point in participants (d) ZNDMXI3 and (e) ZNED4XZ. Microbial abundance is scaled by row with low (blue) and high (red) abundance.
Extended Data Fig 5.
Extended Data Fig 5.. Multi-omics of glucose metabolism and inflammation.
(a) Proteins and metabolites associated with HbA1C, FPG, and hsCRP using healthy-baseline and dynamic linear mixed models. Healthy-baseline models (HbA1C n = 101, samples 560; FPG n = 101, samples 563; hsCRP n = 98, samples 518) account for repeated measures at healthy time points. Dynamic models are similar models except that analytes are normalized across individuals to the first measurement and all time points in the study are used (HbA1C n = 94, samples = 836; FPG n = 94, samples = 843; hsCRP n = 92, samples 777). Individual analyte p-values were determined using a two-sided t-test. Multiple testing correction was performed and molecules were considered significant when BH FDR < 0.2. Model estimates were normalized in each condition so the maximum value equal 1 and the minimal value equal −1. (b) Integrative pathway analysis using IMPaLa (http://impala.molgen.mpg.de) of proteins and metabolites associated with HbA1C (n = 101, samples 560), FPG (n = 101, samples 563), and hsCRP (n = 98, samples 518) as determined by the healthy-baseline models (BH FDR < 0.2 at molecule level which matched to known pathways. Significance of pathways for proteins and metabolites separately is determined by the hypergeometric test (one-sided) followed by Fisher’s combined probability test (one-sided) to determine combined pathway significance (BH FDR < 0.05; n’s of proteins and metabolites for each pathway are provided in Tables S9, S11, S13).
Extended Data Fig 6.
Extended Data Fig 6.. Outlier Analysis of RNA-seq data.
(a) Number of outlier RNA molecules (95th percentile) in each participant. Outlier analysis was performed on Z-scores calculated on the median expression level of each gene at healthy visits in individuals with at least 3 healthy visits (n = 63). The box is defined as 25th and 75th quartile. The upper whisker extends to 1.5 times the interquartile range from the box and the lower whisker to the lowest data point. The horizontal bar in the box is the median value. (b) Selected clinical lab and metabolite trajectories (7 measurement time points) for participant ZJTKAE3 showing a concomitant increase of bile acids and glutamyl dipeptides with ALT (alanine aminotransferase) and AST (aspartate aminotransferase).
Extended Data Fig 7.
Extended Data Fig 7.. Multidimensional cardiac risk assessment.
(a) Distribution of ASCVD risk scores (n = 35, 36 measurements) and cardiovascular imaging and physiology measures that have been established as cardiovascular risk markers. (Abbreviations: RWT-relative wall thickness, LV GLS-left ventricular global longitudinal strain, E/e’ - ratio of mitral peak velocity of early filling (E) to early diastolic mitral annular velocity (e'), PWV-pulse wave velocity). Please note that thresholds for PWV are age-related. Box plots were derived to display quartiles (Q1, median, Q3) with the upper whisker being Q3 plus 1.5*(interquartile range) and the lower whisker extending to Q1 minus 1.5*(interquartile range) or the lowest data point. (b) Ultrasound of carotid plaque (6 participants of 36 had an ultrasound finding of carotid plaque) and relative distribution of ASCVD risk score, HbA1C and LV GLS in function of presence or absence of carotid plaque (Student’s t-test (two-sided) was used to evaluate differences between groups; n = 35, 36 measurements). Error bars represent one standard deviation from the mean (upper edge of box). (c) Correlation network of selected metrics collected during cardiovascular assessment which associated (Spearman correlation (two-sided) with ASCVD risk score (q-value < 0.2); n = 35 participants with 36 measurements. (d) Composite Z-score of ZOBX723 (unstable angina with stent placement) and ZNED4XZ (mild stroke with full recovery and transition to diabetes). For ZOBX723, day 829 occurred 3 weeks post stent placement. Day 679 was a mid-infection time point. For ZNED4XZ, day 699 was the time point prior to the participant’s transition to diabetes and day 846 was the first diabetic time point. The stroke occurred on day 307 for this individual. Gray dots represent Z-scores of other participants (n=101 with 859 samples). (e) Violin plot showing the same data as (d) (n = 101 with 859 samples). The box plot shows the 1st (lower edge of box), median (middle line) and 3rd (upper edge of box) quartiles. The upper whisker is the 3rd quartile + 1.5*(interquartile range) and the lower whisker is the lowest data point.
Figure 1.
Figure 1.. Study design and data collection.
Overview of the in-depth longitudinal phenotyping used to determine health risk and status. Data types were categorized as: Standard (Blue), Enhanced (Purple) and Emerging (Red) tests. PBMCs: peripheral blood mononuclear cells; HbA1C: glycated hemoglobin; OGTT: oral glucose tolerance test; SSPG: steady-state plasma glucose; CBC: complete blood count; hsCRP: high sensitivity C-reactive protein; CVD: cardiovascular disease.
Figure 2.
Figure 2.. Clinical and enhanced phenotyping of glucose metabolism, insulin production and resistance.
(a) Transitions in diabetes mellitus (DM) status (n = 109). 1st column: Self-reported DM status; 2nd column: DM status determined by self-report; medical records and study entry diabetes-related laboratory measures: FPG, HbA1C and OGTT; prediabetic range (100 mg/dL ≤ FPG < 126 mg/dL or 5.7% ≤ HbA1C < 6.5% or 140 mg/dL ≤ OGTT < 200 mg/dL); diabetic range (FPG ≥ 126 mg/dL or HbA1C ≥ 6.5% or OGTT (2-hour) ≥ 200 mg/dL); 3rd column: DM history and status determined by the initial report and diabetes-related laboratory measures over the course of the study. For FPG to be considered impaired or diabetic, two values in these ranges were required over the course of the study, whereas for HbA1C and OGTT only one value was required. (b) Overlap of diabetic range labs by participants over the course of the study. Diabetic ranges are as in panel (a). (c) Violin plots showing insulin levels during OGTT at 0, 30 and 120 minutes, SSPG (steady-state plasma glucose, n = 43 participants) and glucose disposition index (n = 89 samples from 61 participants) by glycemic status determined by OGTT including normoglycemic, impaired fasting glucose only (IFG only: FPG ≥ 100 mg/dL), and impaired glucose tolerance (IGT: OGTT ≥ 140 mg/dL). SSPG was measured using the modified insulin suppression test. The disposition index was calculated as the insulin secretion rate at 30 minutes times the Matsuda index (pmol/kg/min). A two-sided Wilcoxon t-test was used for differential analysis. The violin plots illustrate kernel probability density (i.e. the width represents the proportion of the data) and the horizontal bar depicts the median of the distribution. (d) Heatmap showing insulin secretion rates which were row-standardized and clustered using k-mean clustering (n = 89 samples from 61 participants). Observations within clusters were ordered by OGTT status. OGTT status, disposition index (DI), SSPG and insulin secretion rate max (ISR) are indicated on the left side of the heatmap. (e) Correlation network of multi-omics measures associated with the glucose disposition index (n = 89 samples from 61 participants; Benjamin-Hochberg FDR < 0.1). Correlations were calculated using Spearman correlation and considered significant if Bonferroni FDR < 0.05. Only networks containing a minimum of three molecules were plotted.
Figure 3.
Figure 3.. Longitudinal individual phenotyping and multi-omics of glucose metabolism and inflammation.
Longitudinal diabetic measures demonstrating different patterns of DM onset and progression with (a) initial abnormality response to glucose load (OGTT), (b) initial abnormality in fasting glucose metabolism (FPG) and (c) initial improvement followed by progression. Diabetic-range metrics are indicated in red. (d) Clinical markers and immune proteins associated with HbA1C, FPG, and hsCRP using healthy-baseline and dynamic models. Healthy-baseline models are linear mixed models that take into account repetitive measures across participants (HbA1C n = 101, samples 560; FPG n = 101, samples 563; hsCRP n = 98, samples 518). Dynamic models are similar models except that analytes are normalized across individuals to the first measurement and all time points in the study are used (HbA1C n = 94, samples = 836; FPG n = 94, samples = 843; hsCRP n = 92, samples 777). Each analyte was modeled separately and the two sided t-test was used to determine p-value for each analyte effect. Multiple testing correction was performed and molecules were considered significant when Benjamin-Hochberg (BH) FDR < 0.2. Model estimates were normalized in each condition so the maximum value equal 1 and the minimal value equal −1. (e) Integrative pathway analysis using IMPaLa of proteins and metabolites associated with HbA1C (n = 94, samples = 836), FPG (n = 94, samples = 843), and hsCRP (n = 92, samples 777) as determined by the dynamic models (BH FDR < 0.2 at molecule level). Significance of pathways was determined by the hypergeometric test (one-sided) followed by Fisher’s combined probability test (one-sided) to determine combined pathway significance (BH FDR < 0.05). The n’s of proteins and metabolites for each pathway are provided in Tables S15, S17 and S19. (f) Molecules selected in steady-state plasma glucose (SSPG) and oral glucose tolerance test (OGTT) prediction models and associated coefficients. For SSPG prediction, lipidomics data were used in addition to the multi-omics measures. MSE: mean square error.
Figure 4.
Figure 4.. Clinical longitudinal cardiovascular health profiling and multi-omics correlation network of adjusted ASCVD risk.
(a) Distribution of ASCVD risk scores and adjusted ASCVD risk scores (n = 108). The box plot shows the 1st (lower edge of box), median (middle line) and 3rd (upper edge of box) quartiles. The upper whisker is the 3rd quartile + 1.5*(interquartile range) and the lower wisker is the lowest data point. (b) Self-reported cholesterol status versus measured total cholesterol profiles at study entry and over the course of the study (n = 108). (c) Multi-omics correlation network of molecules associated with adjusted ASCVD risk score (n = 77 participants) using Spearman correlation and multiple testing correction of q-value < 0.2. Correlations between molecules were then calculated using Spearman correlation and considered significant if Bonferroni corrected p-value < 0.1. Only molecules belonging to the main network were plotted.
Figure 5.
Figure 5.. Oncologic discoveries.
(a) Abdominal ultrasound image where a mildly enlarged spleen measuring approximately 13 cm in craniocaudal dimension can be seen. (b) Positron emission tomography (PET) imaging where a large retroperitoneal mass with high fluorodeoxyglucose (FDG) and intensely focal hypermetabolism occupying the majority of the spleen can be seen. (c) Lactate Dehydrogenase (LDH) levels at time of index imaging and after starting chemotherapy. (d) Levels of MIG (CXCL9) demonstrating an increase starting a year prior to diagnosis that peaks at time of diagnosis and goes back to baseline after treatment (n=11 samples). Benjamin-Hochberg (BH) p-value (two-sided) was calculated on MIG Z-scores assuming a normal distribution across all healthy visits in the cohort (n = 601 samples). (e) Functional association network of outlier proteins (95th percentile) at time of diagnostic. This analysis was performed using the web-tool STRING (https://version-10-5.string-db.org/). Edges correspond to known, predicted or other interactions. (f) Shannon diversity of the gut microbiome decreasing months prior to diagnosis, reaching a minimum value at time of diagnostic and returning to baseline after treatment (n = 11 samples). Trajectory was then modeled using a general additive model which separates the linear (β = −0.197, p = 0.002 (2-sided t-test)) and non-linear (df = 3, p = 0.0112 (one-sided Chi-sq)) components. An F-test (one-sided) was used to compare the model including time to the null model. (g) IgM (Immunoglobulin M) level distribution in the cohort (n = 109, samples 1,111). Benjamin-Hochberg (BH) p-value (two-sided) was calculated on IgM Z-scores assuming a normal distribution across all visits in the cohort. Outlier visits are from a participant that was diagnosed with monoclonal gammopathy of undetermined significance (MGUS). The box plot shows the 1st (lower edge of box), median (middle line) and 3rd (upper edge of box) quartiles. The upper whisker is the 3rd quartile + 1.5*(interquartile range) and the lower wisker is the lowest data point. The diamond is the mean.
Figure 6.
Figure 6.. Summary of major clinically actionable health discoveries and participant health behavior change.
(a) Summary of clinically relevant health discoveries. 67 discoveries were considered major and the 55 PreDM results were not included in this count. (b) Diet and physical activity modifications. (c) Amount of change made in diet and exercise (5-point scale was used with 1 being no change and 5 being significant change). MODY: Maturity onset diabetes of the young; DM: diabetes mellitus; PreDM: prediabetes mellitus; afib: atrial fibrillation; SVT: supraventricular tachycardia; CV: cardiovascular; MGUS: monoclonal gammopathy of undetermined significance.

Comment in

References

    1. National Research Council (US) Committee on A Framework for Developing a New Taxonomy of Disease. Toward Precision Medicine: Building a Knowledge Network for Biomedical Research and a New Taxonomy of Disease. (National Academies Press (US), 2012). - PubMed
    1. Li X et al. Digital Health: Tracking Physiomes and Activity Using Wearable Biosensors Reveals Useful Health-Related Information. PLoS Biol. 15, e2001402 (2017). - PMC - PubMed
    1. Chen R et al. Personal omics profiling reveals dynamic molecular and medical phenotypes. Cell 148, 1293–1307 (2012). - PMC - PubMed
    1. Price ND et al. A wellness study of 108 individuals using personal, dense, dynamic data clouds. Nat. Biotechnol. (2017). doi: 10.1038/nbt.3870 - DOI - PMC - PubMed
    1. Perkins BA et al. Precision medicine screening using whole-genome sequencing and advanced imaging to identify disease risk in adults. Proc. Natl. Acad. Sci. U. S. A. (2018). doi: 10.1073/pnas.1706096114 - DOI - PMC - PubMed

Publication types