

Rising rural body-mass index is the main driver of the global obesity epidemic in adults
- PMID: 31068725
- PMCID: PMC6784868
- DOI: 10.1038/s41586-019-1171-x
Rising rural body-mass index is the main driver of the global obesity epidemic in adults
Abstract
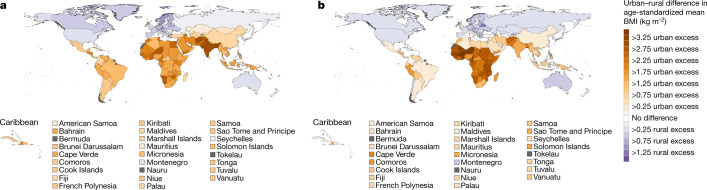
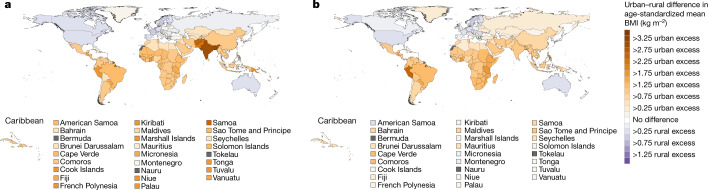
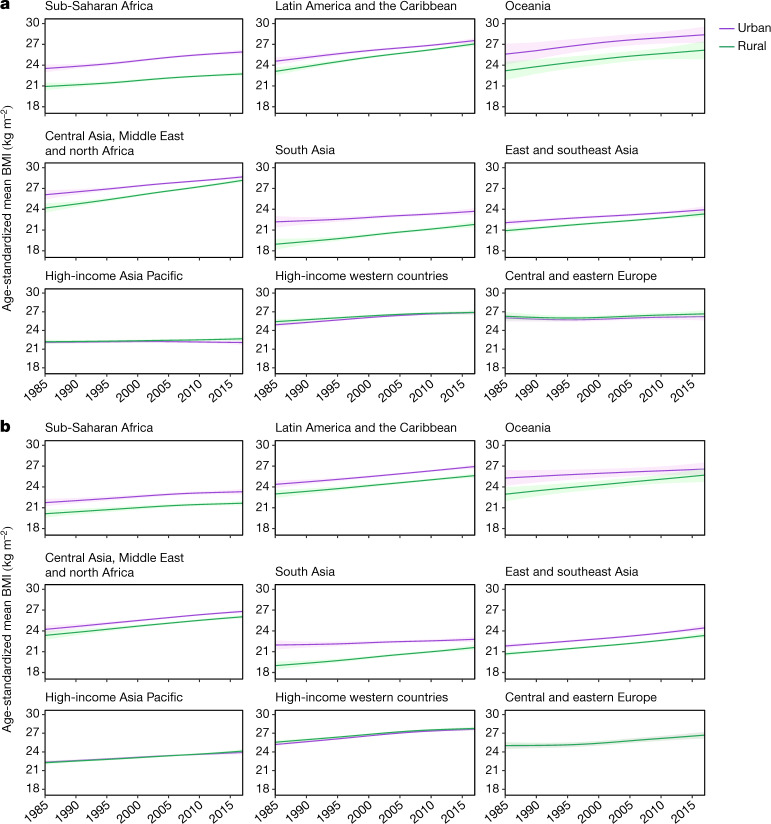
Body-mass index (BMI) has increased steadily in most countries in parallel with a rise in the proportion of the population who live in cities1,2. This has led to a widely reported view that urbanization is one of the most important drivers of the global rise in obesity3-6. Here we use 2,009 population-based studies, with measurements of height and weight in more than 112 million adults, to report national, regional and global trends in mean BMI segregated by place of residence (a rural or urban area) from 1985 to 2017. We show that, contrary to the dominant paradigm, more than 55% of the global rise in mean BMI from 1985 to 2017-and more than 80% in some low- and middle-income regions-was due to increases in BMI in rural areas. This large contribution stems from the fact that, with the exception of women in sub-Saharan Africa, BMI is increasing at the same rate or faster in rural areas than in cities in low- and middle-income regions. These trends have in turn resulted in a closing-and in some countries reversal-of the gap in BMI between urban and rural areas in low- and middle-income countries, especially for women. In high-income and industrialized countries, we noted a persistently higher rural BMI, especially for women. There is an urgent need for an integrated approach to rural nutrition that enhances financial and physical access to healthy foods, to avoid replacing the rural undernutrition disadvantage in poor countries with a more general malnutrition disadvantage that entails excessive consumption of low-quality calories.
Conflict of interest statement
M.E. reports a charitable grant from the AstraZeneca Young Health Programme, and personal fees from Prudential, Scor and Third Bridge, outside the submitted work. The other authors declare no competing interests.
Figures


Comment in
-
Rural areas drive increases in global obesity.Nature. 2019 May;569(7755):200-201. doi: 10.1038/d41586-019-01182-x. Nature. 2019. PMID: 31068717 No abstract available.
References
-
- United Nations Department of Economic and Social Affairs, Population Division. World Urbanization Prospects: the 2014 Revision. https://esa.un.org/unpd/wup/publications/files/wup2014-report.pdf (United Nations, 2015).
-
- WHO. Global Report on Urban Health: Equitable Healthier Cities for Sustainable Development. Report No. 9241565276. https://apps.who.int/iris/handle/10665/204715 (World Health Organization, 2016).
-
- Yusuf, S., Reddy, S., Ôunpuu, S. & Anand, S. Global burden of cardiovascular diseases: part I: general considerations, the epidemiologic transition, risk factors, and impact of urbanization. Circulation104, 2746–2753 (2001). - PubMed
-
- Wagner, K. H. & Brath, H. A global view on the development of non communicable diseases. Prev. Med. 54, S38–S41 (2012). - PubMed
Publication types
MeSH terms
Grants and funding
- K43 TW010698/TW/FIC NIH HHS/United States
- G0500300/MRC_/Medical Research Council/United Kingdom
- MC_UP_1204/16/MRC_/Medical Research Council/United Kingdom
- MC_UU_12011/3/MRC_/Medical Research Council/United Kingdom
- 14136/CRUK_/Cancer Research UK/United Kingdom
- G0401527/MRC_/Medical Research Council/United Kingdom
- 19583/VAC_/Versus Arthritis/United Kingdom
- HOP001\1029/AMS_/Academy of Medical Sciences/United Kingdom
- 209376/WT_/Wellcome Trust/United Kingdom
- RG/13/16/30528/BHF_/British Heart Foundation/United Kingdom
- MC_U147585824/MRC_/Medical Research Council/United Kingdom
- MC_U147585827/MRC_/Medical Research Council/United Kingdom
- 101506/WT_/Wellcome Trust/United Kingdom
- MR/N003284/1/MRC_/Medical Research Council/United Kingdom
- RG/19/4/34452/BHF_/British Heart Foundation/United Kingdom
- P30 DK058404/DK/NIDDK NIH HHS/United States
- 205208/WT_/Wellcome Trust/United Kingdom
- MC_U147585819/MRC_/Medical Research Council/United Kingdom
- G1000143/MRC_/Medical Research Council/United Kingdom
- MC_UU_12015/1/MRC_/Medical Research Council/United Kingdom
- MC_UP_A620_1014/MRC_/Medical Research Council/United Kingdom
- MC_UU_00019/2/MRC_/Medical Research Council/United Kingdom
- MC_UU_00017/1/MRC_/Medical Research Council/United Kingdom
- MC_UU_12011/1/MRC_/Medical Research Council/United Kingdom
- G0400519/MRC_/Medical Research Council/United Kingdom
- G0400491/MRC_/Medical Research Council/United Kingdom
- 201804/WT_/Wellcome Trust/United Kingdom
- MC_UP_A620_1016/MRC_/Medical Research Council/United Kingdom
LinkOut - more resources
Full Text Sources
Medical
Miscellaneous
