

Oxidation of Volatile Organic Compounds as the Major Source of Formic Acid in a Mixed Forest Canopy
- PMID: 31068737
- PMCID: PMC6487833
- DOI: 10.1029/2018GL081526
Oxidation of Volatile Organic Compounds as the Major Source of Formic Acid in a Mixed Forest Canopy
Abstract
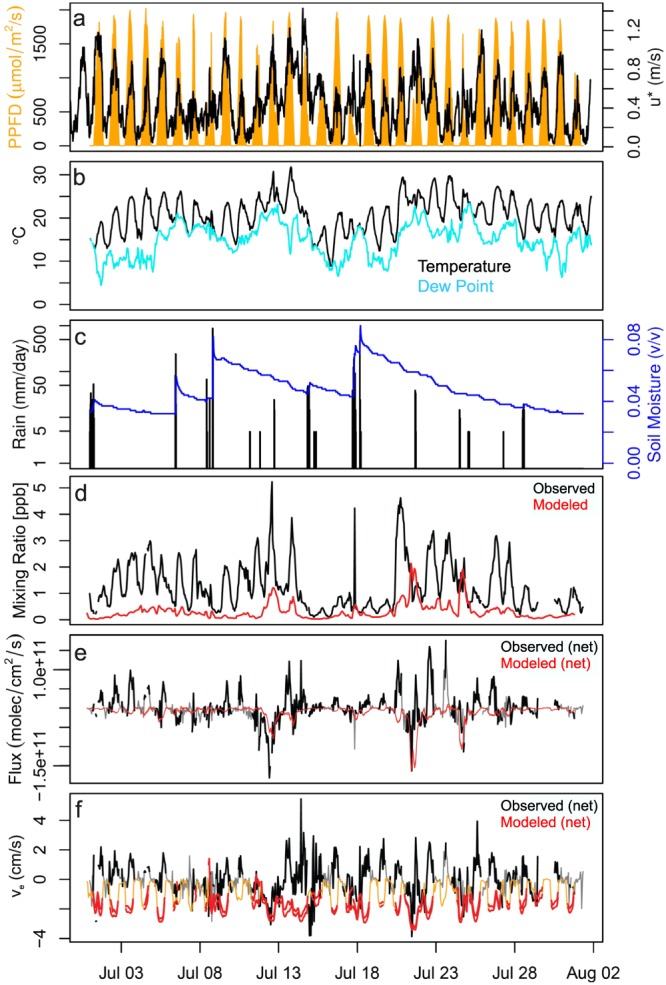
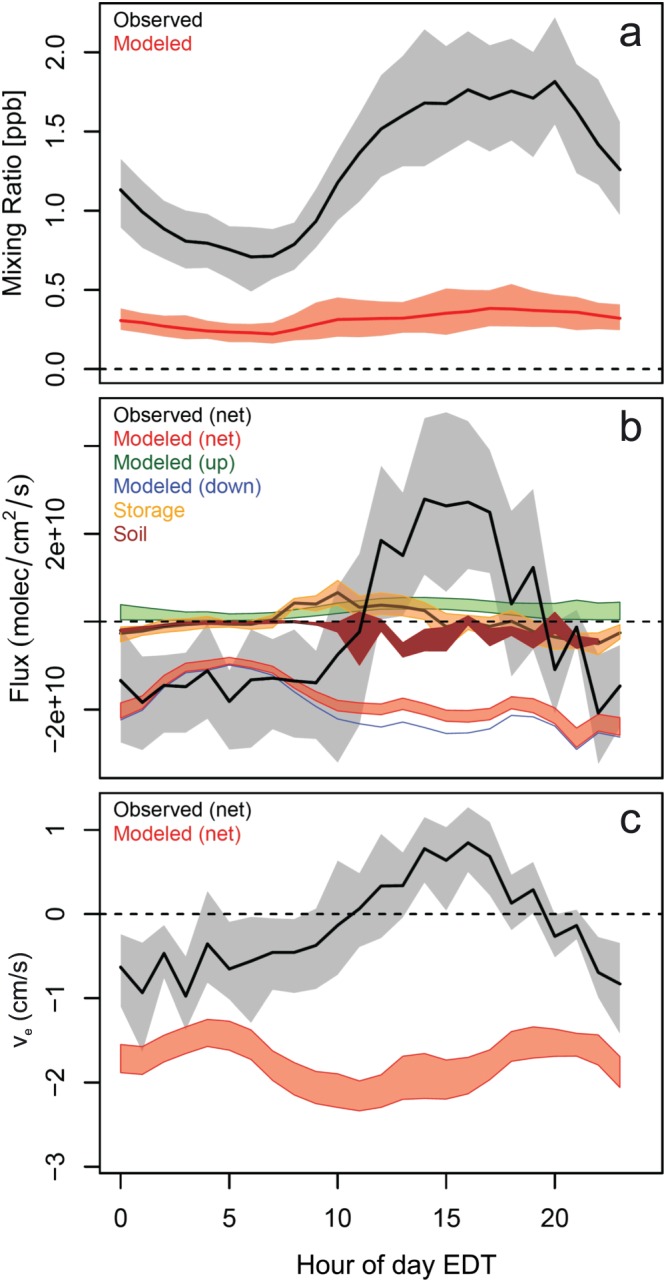
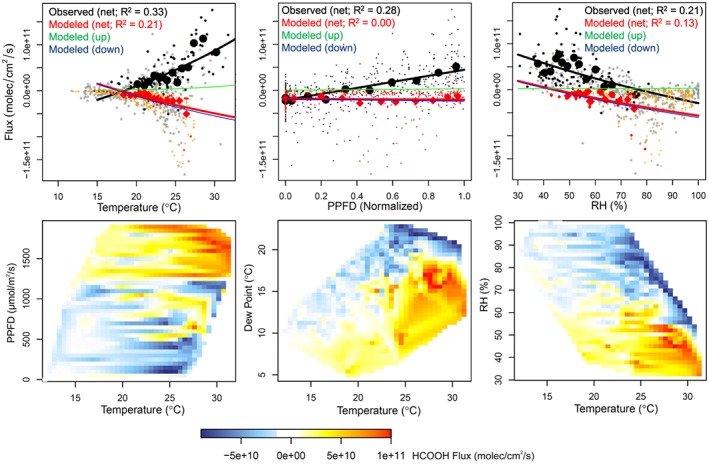
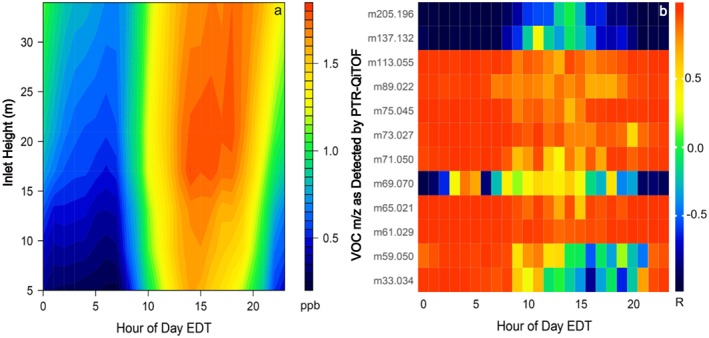
Formic acid (HCOOH) is among the most abundant carboxylic acids in the atmosphere, but its budget is poorly understood. We present eddy flux, vertical gradient, and soil chamber measurements from a mixed forest and apply the data to better constrain HCOOH source/sink pathways. While the cumulative above-canopy flux was downward, HCOOH exchange was bidirectional, with extended periods of net upward and downward flux. Net above-canopy fluxes were mostly upward during warmer/drier periods. The implied gross canopy HCOOH source corresponds to 3% and 38% of observed isoprene and monoterpene carbon emissions and is 15× underestimated in a state-of-science atmospheric model (GEOS-Chem). Gradient and soil chamber measurements identify the canopy layer as the controlling source of HCOOH or its precursors to the forest environment; below-canopy sources were minor. A correlation analysis using an ensemble of marker volatile organic compounds suggests that secondary formation, not direct emission, is the major source driving ambient HCOOH.
Keywords: Eddy co‐variance fluxes; Formic acid.
Figures
References
-
- Allen, H. M. , Crounse, J. D. , Bates, K. H. , Teng, A. P. , Krawiec‐Thayer, M. P. , Rivera‐Rios, J. C. , Keutsch, F. N. , St. Clair, J. M. , Hanisco, T. F. , Møller, K. H. , Kjaergaard, H. G. , & Wennberg, P. O. (2018). Kinetics and product yields of the OH initiated oxidation of hydroxymethyl hydroperoxide. The Journal of Physical Chemistry A, 122, 6292–6302. 10.1021/acs.jpca.8b04577 - DOI - PubMed
-
- Atkinson, R. , Baulch, D. L. , Cox, R. A. , Crowley, J. N. , Hampson, R. F. , Hynes, R. G. , Jenkin, M. E. , Rossi, M. J. , Troe, J. , & IUPAC Subcommittee (2006). Evaluated kinetic and photochemical data for atmospheric chemistry: Volume II—Gas phase reactions of organic species. Atmospheric Chemistry and Physics, 6, 3625–4055. 10.5194/acp-6-3625-2006 - DOI
-
- Bannan, T. J. , Bacak, A. , Muller, J. B. , Booth, A. M. , Jones, B. , Le Breton, M. , & Percival, C. J. (2014). Importance of direct anthropogenic emissions of formic acid measured by a chemical ionisation mass spectrometer (CIMS) during the Winter ClearfLo Campaign in London, January 2012. Atmospheric Environment, 83, 301–310. 10.1016/j.atmosenv.2013.10.029 - DOI
-
- Bannan, T. J. , Booth, A. M. , Le Breton, M. , Bacak, A. , Muller, J. B. , Leather, K. E. , Khan, M. A. H. , Lee, J. D. , Dunmore, R. E. , Hopkins, J. R. , Fleming, Z. L. , Sheps, L. , Taatjes, C. A. , Shallcross, D. E. , & Percival, C. J. (2017). Seasonality of formic acid (HCOOH) in London during the ClearfLo campaign. Journal of Geophysical Research: Atmospheres, 122, 12,488–12,498. 10.1002/2017JD027064 - DOI
-
- Bryan, A. M. , Cheng, S. J. , Ashworth, K. , Guenther, A. B. , Hardiman, B. S. , Bohrer, G. , & Steiner, A. L. (2015). Forest‐atmosphere BVOC exchange in diverse and structurally complex canopies: 1‐D modeling of a mid‐successional forest in northern Michigan. Atmospheric Environment, 120, 217–226. 10.1016/j.atmosenv.2015.08.094 - DOI
Grants and funding
LinkOut - more resources
Full Text Sources