. 2019 Apr 24:10:864.
doi: 10.3389/fimmu.2019.00864. eCollection 2019.

CD28 Individual Signaling Up-regulates Human IL-17A Expression by Promoting the Recruitment of RelA/NF-κB and STAT3 Transcription Factors on the Proximal Promoter

Affiliations

CD28 Individual Signaling Up-regulates Human IL-17A Expression by Promoting the Recruitment of RelA/NF-κB and STAT3 Transcription Factors on the Proximal Promoter

Martina Kunkl et al. Front Immunol. .

Abstract

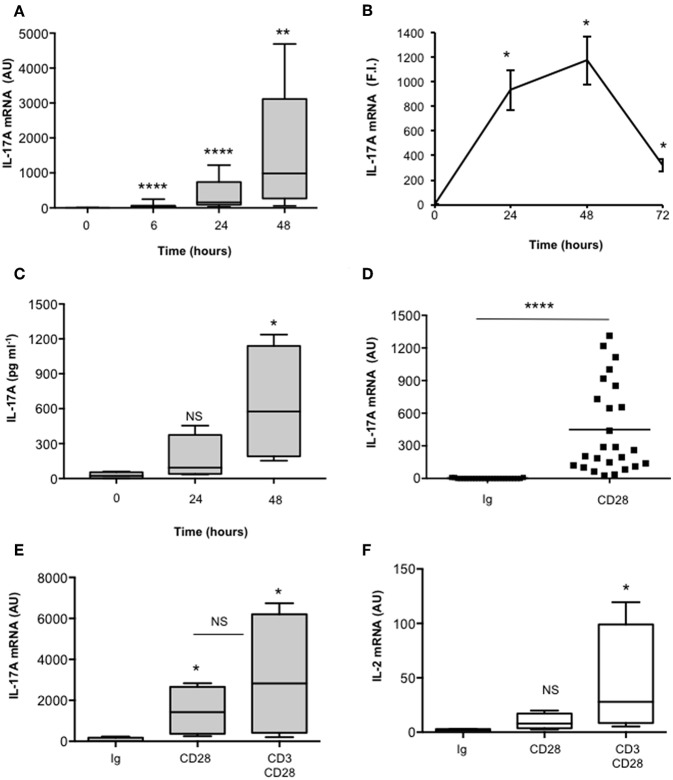
CD28 is an important co-stimulatory receptor for T lymphocytes that, in humans, delivers TCR-independent signal leading to the up-regulation of pro-inflammatory cytokines. We have recently reported that CD28 autonomous signaling induces the expression of IL-17A in peripheral CD4+ T lymphocytes from healthy donors, multiple sclerosis, and type 1 diabetes patients. Due to the relevance of IL-17A in the pathophysiology of several inflammatory and autoimmune diseases, we characterized the mechanisms and signaling mediators responsible for CD28-induced IL-17A expression. Here we show that CD28-mediated up-regulation of IL-17A gene expression depends on RelA/NF-κB and IL-6-associated STAT3 transcriptions factors. In particular, we found that CD28-activated RelA/NF-κB induces the expression of IL-6 that, in a positive feedback loop, mediates the activation and nuclear translocation of tyrosine phosphorylated STAT3 (pSTAT3). pSTAT3 in turn cooperates with RelA/NF-κB by binding specific sequences within the proximal promoter of human IL-17A gene, thus inducing its expression. Finally, by using specific inhibitory drugs, we also identified class 1A phosphatidylinositol 3-kinase (PI3K) as a critical upstream regulator of CD28-mediated RelA/NF-κB and STAT3 recruitments and trans-activation of IL-17A promoter. Our findings reveal a novel mechanism by which human CD28 may amplify IL-17A expression in human T lymphocytes and provide biological bases for immunotherapeutic approaches targeting CD28-associated class 1A PI3K to dampen IL-17A-mediated inflammatory response in autoimmune/inflammatory disorders.

Keywords: CD28; IL-17 A; NF-kappa B; STAT3; T lymphocytes.


Figures

Figure 1
Figure 1
CD28 stimulation up-regulates IL-17A gene expression and production. (A) CD4+ T cells from HD subjects (n = 11) were stimulated for the indicated times with 2 μg ml−1 isotype control or anti-CD28.2 Abs. IL-17A mRNA levels were measured by real-time PCR and values, normalized to GAPDH, expressed as arbitrary units (AU). Lines represent median values and statistical significance was calculated by Mann-Whitney test. Median values: 0 h = 1, 6 h = 31, 24 h = 154, 48 h = 985. (B) IL-17A mRNA levels of CD4+ T cells stimulated for the indicated times with isotype control or anti-CD28.2 Abs. IL-17A mRNA levels were measured by real-time PCR and values, normalized to GAPDH, were expressed as fold inductions (F.I.) over the basal level of cells stimulated isotype control Ig. Data show the mean ± SD of one experiment representative of three. Statistical significance was calculated by Student t-test. (C) CD4+ T cells from HD subjects (n = 4) were stimulated for 24 or 48 h with isotype control or crosslinked anti-CD28.2 Abs. IL-17A levels in culture supernatant were measured by ELISA. Lines represent median values and statistical significance was calculated by Mann-Whitney test. Median values: 0 h = 22 pg ml−1, 24 h = 93 pg ml−1, 48 h = 575 pg ml−1. (D) IL-17A mRNA levels of CD4+ T cells from HD subjects (n = 25) stimulated for 24 h with isotype control Ig or anti-CD28.2 Abs. Lines represent median values (AU) and statistical significance was calculated by Mann-Whitney test. Median values: Ig = 2.8, CD28 = 449. (E) IL-17A mRNA levels of CD4+ T cells from HD subjects (n = 4) stimulated for 24 h with isotype control Ig or anti-CD28.2 or anti-CD3 (UCHT1) plus anti-CD28.2 Abs. Lines represent median values (AU) and statistical significance was calculated by Mann-Whitney test. Median values: Ig = 8, CD28 = 1427, CD3/CD28 = 2823. (F) IL-2 mRNA levels of CD4+ T cells from HD subjects (n = 4) stimulated for 24 h with isotype control Ig or anti-CD28.2 or anti-CD3 (UCHT1) plus anti-CD28.2 Abs. Lines represent median values (AU) and statistical significance was calculated by Mann-Whitney test. Median values: Ig = 1.7, CD28 = 8, CD3/CD28 = 28. *p < 0.05, **p < 0.01, ****p < 0.0001, calculated on cells stimulated with isotype control Ig.
Figure 2
Figure 2
CD28-induced IL-17A gene expression depends on IL-6. (A) Kinetic analysis of IL-6 gene expression in CD4+ T cells from HD (n = 5) stimulated for the indicated times with isotype control Ig or anti-CD28.2 Abs. IL-6 mRNA levels were measured by real-time PCR and values, normalized to GAPDH, expressed as AU. Lines represent median values and statistical significance was calculated by Mann-Whitney test. Median values: 0 h = 19, 6 h = 300, 24 h = 60. (B) IL-6 mRNA levels of CD4+ T cells from HD (n = 19) stimulated for 6 h with isotype control Ig or anti-CD28.2 Abs. Lines represent median values (AU) and statistical significance was calculated by Mann-Whitney test. Median values: Ig = 1.12, CD28 = 163.1. (C) CD4+ T cells from HD subjects (n = 5) were stimulated for 24 h with isotype control Ig or crosslinked anti-CD28.2 Abs. IL-6 levels in culture supernatant were measured by ELISA. Bars show the mean ± SD. Statistical significance was calculated by Student t-test. Mean values ± SD: Ig = 22 ± 12 pg ml−1, CD28 = 236 ± 47 pg ml−1. (D) TGFβ mRNA levels of CD4+ T cells from HD (n = 4) stimulated for 6 h with isotype control Ig or crosslinked anti-CD28.2 Abs. Lines represent median values (AU) and statistical significance was calculated by Mann-Whitney test. Median values: Ig = 1.5, CD28 = 0.95. (E) RORC mRNA levels of CD4+ T cells from HD (n = 8) stimulated for the indicated times with isotype control Ig or crosslinked anti-CD28.2 Abs. Lines represent median values (AU) and statistical significance was calculated by Mann-Whitney test. Median values: 0 h = 1.1, 6 h = 1.2, 24 h = 0.4. (F) IL-17A mRNA levels in CD4+ T cells from HD (n = 5) stimulated for 24 h with isotype control Ig or anti-CD28.2 Abs in the presence of 10 μg ml−1 isotype control or neutralizing anti-IL-6 Abs. The values were normalized to GAPDH and fold inductions over isotype control Ig-stimulated cells were calculated. IL-17A mRNA values of CD28-stimulated cells were assumed as 100%. Data express the mean ± SD. Statistical significance was calculated by Student t-test. *p < 0.05, **p < 0.01, ****p < 0.0001, calculated on cells stimulated with isotype control Ig.
Figure 3
Figure 3
STAT3 regulates CD28-mediated up-regulation of IL-17A. (A) CD4+ T cells were stimulated for the indicated times with isotype control Ig or anti-CD28.2 Abs and STAT3 phosphorylation on tyrosine 705 (pSTAT3) and GAPDH levels were analyzed by western blotting. (B) pSTAT3 fold inductions (F.I.) were quantified by densitometric analysis and normalized to GAPDH levels. Bars represent mean F.I. ± SEM of three HD. *p < 0.05, **p < 0.01 calculated by Student t-test. (C) CD4+ T cells from HD (n = 4) were cultured for 24 h with medium (Med) or DMSO, as vehicle control, or 100 μM S31-201 STAT3 inhibitor. Cell death was analyzed by flow cytometry by quantifying the ability of cells to incorporate propidium iodide (PI). The percentage of PI positive cells was calculated. Results express the mean ± SEM. (D) Western blotting of pSTAT3 and GAPDH levels in CD4+ T cell treated with DMSO, as vehicle control, or S31-201 and stimulated for 6 h with isotype control Ig or anti-CD28.2 Abs. (E) pSTAT3 fold inductions (F.I.) were quantified by densitometric analysis and normalized to GAPDH levels. Bars represent mean F.I. ± SEM of three HD. *p < 0.05, calculated by Student t-test. NS, not significant. (F) IL-17A mRNA levels in CD4+ T cells from HD (n = 5) treated with DMSO or S31-201 and stimulated for 24 h with isotype control Ig or anti-CD28 Abs. Lines represent median values (AU) and statistical significance was calculated by Mann-Whitney test. Median values: DMSO Ig = 1, DMSO CD28 = 551, S31-201 Ig = 1.94, S31-201 CD28 = 18. **p < 0.01.
Figure 4
Figure 4
CD28-activated NF-κB regulates IL-17A expression. (A) CD4+ T cells were stimulated for the indicated times with isotype control Ig or anti-CD28.2 Abs and RelA and lamin B1 levels in nuclear extracts were analyzed by western blotting. (B) RelA fold inductions (F.I.) were quantified by densitometric analysis and normalized to lamin B levels. Bars represent mean F.I. ± SEM of two HD. Significance was calculated by Student t-test. *p < 0.05, **p < 0.01, ****p < 0.000.1 (C) NF-κB luciferase activity of Jurkat cells treated with DMSO, as vehicle control, or 5 μM MG132 or 10 μM PS1145 and stimulated for 6 h in the absence or presence of Dap3 (B7-) or Dap3/B7 cells (B7). The results are expressed as the mean of luciferase units ± SD after normalization to GFP values. The data are representative of three independent experiments. Significance was calculated by Student t-test. **p < 0.01, ***p < 0.001. Mean values ± SD: DMSO = 1.9 ± 1.1, DMSO B7 = 2.3 ± 0.9, DMSO B7 = 15.15 ± 0.12, PS1145 B7 = 4.72 ± 0.11, MG132 B7 = 5.71 ± 0.11. (D) Western blotting of pSTAT3, RelA, and lamin A/C levels in nuclear extracts of CD4+ treated with DMSO, as vehicle control, or PS1145, or MG132 and stimulated for 6 h with isotype control Ig or anti-CD28.2 Abs. pSTAT3 (E) and RelA (F) fold inductions (F.I.) were quantified by densitometric analysis and normalized to lamin B levels. Bars represent mean F.I. ± SEM of three HD. Significance was calculated by Student t-test. *p < 0.05. (G,H) IL-6 (G) and IL-17A (H) mRNA levels of CD4+ T cell from HD (n = 5) untreated or treated with DMSO, as vehicle control, or PS1145, or MG132 and stimulated for 6 h (G) or 24 h (H) with isotype control Ig or anti-CD28.2 Abs. The values were normalized to GAPDH and fold inductions (F.I.) over isotype control Ig-stimulated cells were calculated. Lines represent median values and statistical significance was calculated by Mann-Whitney test. *p < 0.05, **p < 0.01, ***p < 0.001, ****p < 0.0001. Median values: IL-6, DMSO Ig = 1, DMSO CD28 = 11, PS1145 CD28 = 0.4, MG132 CD28 = 2.8; IL-17A, DMSO Ig = 1, DMSO CD28 = 98.8, PS1145 CD28 = 19.4, MG132 CD28 = 4.3.
Figure 5
Figure 5
STAT3 and RelA/NF-κB transcription factors regulate CD28-mediated transactivation of IL-17A promoter. (A) Sequence of the 1.2 kb region upstream of the transcriptional start point of human IL-17A gene. The binding sites of NF-κB (yellow), STAT3 (light blue), and the TATA box (red) are indicated. (B) CD28-positive Jurkat cells were transfected with 5 μg pGL3E-hIL-17prom(-1125)-luciferase construct [hIL-17p(-1125)-Luc] and then stimulated for 6 h with isotype control Abs (Ig), or anti-CD28.2, or anti-CD3 (UCHT1) plus anti-CD28.2 Abs. The results are expressed as the mean of luciferase units ± SD. Significance was calculated by Student t-test. ***p < 0.001. NS, not significant. Mean ± SD: Ctr = 0.65 ± 0.09, B7 = 3.5 ± 0.53, CD28 = 3.5 ± 0.44, CD3/CD28 = 4.12 ± 0.38 The data are representative of three independent experiments. (C) hIL-17p(-1125)-luciferase activity of Jurkat cells stimulated for 6 h with medium (Med) or Dap3/B7 (B7) cells. Lines represent median values of eight independent experiments and statistical significance was calculated by Mann-Whitney test. **p < 0.01. Median values: Med = 1.34, B7 = 4.98. (D) hIL-17p(-1125)-luciferase activity of Jurkat cells transfected with EGFP construct together with vector alone (Vec) or HA-RelA, or Flag-STAT3C expression vectors alone or in combination. Fold inductions (F.I.) over the basal level of luciferase activity in cells transfected with Vec were calculated after normalization to GFP values. The results are expressed as the mean F.I. ± SD of four independent experiments. Significance was calculated by Student t-test. ****p < 0.0001, ***p < 0.001. Mean ± SD: RelA = 3.6 ± 2.2, STAT3C = 3.4 ± 0.9, RelA/STAT3C = 12 ± 1. (E) Anti-RelA, anti-STAT3 and anti-GAPDH western blotting of a Jurkat cells transfected as in (D). Arrows indicate the position of HA-RelA and Flag-STAT3C. Plots represent one of four independent experiments. RelA and STAT3 fold inductions (F.I.) over the basal level of cells transfected with Vec were quantified by densitometric analysis and normalized to GAPDH levels (lower histograms). The results express the mean F.I. ± SD of four independent experiments. Significance was calculated by Student t-test. **p < 0.01, ***p < 0.001.
Figure 6
Figure 6
CD28 stimulation of human CD4+ T cells induces the selective recruitment of RelA and pSTAT3 to IL-17A promoter. (A) CD4+ T cells were stimulated for the indicated times with anti-CD28.2 Abs and anti-RelA, anti-pSTAT3, and anti-Poll II ChIPs were performed. Immunoprecipitated DNA was analyzed by real time PCR with IL-17A promoter specific primers. Specific enrichment over isotype control Abs was calculated by the Cτ method. Data express the mean ± SD of one representative experiment. Significance was calculated by Student t-test. (A–D) Real time PCR for IL-17A promoter from anti-pSTAT3 (B), anti-RelA (C), anti-Pol II (D) ChIPs performed on CD4+ T cells from HD (n = 4) stimulated for the indicated times with isotype control or anti-CD28.2 Abs. Specific enrichment over isotype control Abs was calculated by the Cτ method. Data express the mean ± SD of four independent experiments. Significance was calculated by Student t-test. *p < 0.05, **p < 0.01, NS, not significant. (E) Real time PCR for IL-17A promoter from anti-RelA, anti-RelB, and anti-pSTAT3 ChIPs performed on CD4+ T cells from HD (n = 6) stimulated for 24 h with isotype control or anti-CD28.2 Abs. Specific enrichment over negative control Abs (anti-Lck) was calculated by the Cτ method and data expressed as fold inductions (F.I.) over isotype control Ig-stimulated cells. Data express the mean F.I. ± SD. Statistical significance was calculated by Student t-test. *p < 0.05, **p < 0.01, NS, not significant. Mean ± SD: RelA = 6.7 ± 4.8, RelB = 1 ± 0.4, pSTAT3 = 9 ± 5.9.
Figure 7
Figure 7
Inhibition of class 1 PI3K activity impairs pSTAT3 and RelA nuclear translocations as well as IL-6 and IL-17A gene expression induced by CD28 stimulation. (A,B) CD4+ T cells were treated with DMSO, as vehicle control, or 10 μM AS605240 and then stimulated for 3 h with isotype control Ig or anti-CD28.2 Abs. RelA, RelB, and lamin A/C (A) as well as pSTAT3 and lamin B1 (B) levels in nuclear extracts were analyzed by western blotting. RelA (C) and pSTAT3 (D) fold inductions (F.I.) were quantified by densitometric analysis and normalized to lamin levels. Bars represent mean F.I. ± SEM of three (C) or two (D) HD. Significance was calculated by Student t-test. *p < 0.05. NS, not significant. (E,F) IL-6 (E) and IL-17A (F) mRNA levels of CD4+ T cell from HD (n = 5) treated with DMSO, as vehicle control, or AS605240 and stimulated for 6 h (E) or 24 h (F) with isotype control Ig or anti-CD28.2 Abs. The values were normalized to GAPDH and expressed fold inductions (F.I.) over control Ig-stimulated cells (E) or AU (F). Lines represent median values and statistical significance was calculated by Student t-test (E) or Mann-Whitney test (F). *p < 0.05, **p < 0.01. Median values: IL-6, DMSO Ig = 1, DMSO CD28 = 35.14, AS605240 CD28 = 1.5; IL-17A, DMSO Ig = 11, DMSO CD28 = 1,776, AS605240 CD28 = 21.62.
Figure 8
Figure 8
Inhibition of class 1 PI3K activity impairs CD28-induced recruitment of pSTAT3 and RelA on IL-17A promoter. (A) hIL-17p(-1125)-luciferase activity of Jurkat cells treated with DMSO, as vehicle control, or 10 μM AS605240 and stimulated with Dap/B7 cells (B7). Fold inductions over DMSO un-stimulated cells were calculated. The results express the mean of luciferase units ± SD on one representative experiment of three. Significance was calculated by Student t-test. ***p < 0.001. Mean values ± SD: DMSO = 6.6 ± 0.09, DMSO B7 = 23 ± 1.3, AS605240 = 7.6 ± 0.4, AS605240 B7 = 7.6 ± 0.08. (B,C) Real time PCR for IL-17A promoter from anti-RelA (B) and anti-pSTAT3 (C) ChIPs performed on CD4+ T cells treated with DMSO, as vehicle control, or 10 μM AS605240 and stimulated for 24 h with isotype control Ig or anti-CD28.2 Abs. Specific enrichment over negative control Abs (anti-Lck) was calculated by the Cτ method. Data express the mean ± SD of one representative experiment of three. Significance was calculated by Student t-test. *p < 0.05, **p < 0.01. Mean ± SD: RelA, DMSO Ig = 2 ± 0.04, DMSO CD28 = 28.74 ± 2.65, AS605240 Ig = 1.9 ± 0.06, AS605240 CD28 = 15.09 ± 1.97; pSTAT3, DMSO Ig = 6.97 ± 1.87, DMSO CD28 = 71.85 ± 17.05, AS605240 Ig = 9.25 ± 2.5, AS605240 CD28 = 29.77 ± 3; Pol II, DMSO Ig = 1.4 ± 0.26, DMSO CD28 = 7.05 ± 0.14, AS605240 Ig = 1.66 ± 0.10, AS605240 CD28 = 0.85 ± 0.18. (D) Real time PCR for IL-17A promoter from anti-RelA or anti-pSTAT3 ChIPs performed on CD4+ T cells from HD (n = 3) treated with DMSO, as vehicle control, or 10 μM AS605204 and stimulated for 24 h with isotype control Ig or anti-CD28.2 Abs. Specific enrichment over negative control Abs (anti-Lck) was calculated by the Cτ method and fold inductions over isotype control Ig-stimulated cells were calculated. Values of DMSO-treated and CD28-stimulated cells were assumed as 100%. Data express the mean ± SD. Statistical significance was calculated by Student t-test. ***p < 0.001.

References

    1. Stockinger B, Veldhoen M. Differentiation and function of Th17 T cells. Curr Opin Immunol. (2007) 19:281–6. 10.1016/j.coi.2007.04.005 - DOI - PubMed
    1. Cosmi L, Santarlasci V, Maggi L, Liotta F, Annunziato F. Th17 plasticity: pathophysiology and treatment of chronic inflammatory disorders. Curr Opin Pharmacol. (2014) 17:12–16. 10.1016/j.coph.2014.06.004 - DOI - PubMed
    1. Sandquist I, Kolls J. Update on regulation and effector functions of Th17 cells. F1000Research. (2018) 7:205. 10.12688/f1000research.13020.1 - DOI - PMC - PubMed
    1. Park H, Li Z, Yang XO, Chang SH, Nurieva R, Wang YH, et al. . A distinct lineage of CD4 T cells regulates tissue inflammation by producing interleukin 17. Nat Immunol. (2005) 6:1133–41. 10.1038/ni1261 - DOI - PMC - PubMed
    1. Harrington LE, Hatton RD, Mangan PR, Turner H, Murphy TL, Murphy KM, et al. . Interleukin 17-producing CD4+ effector T cells develop via a lineage distinct from the T helper type 1 and 2 lineages. Nat Immunol. (2005) 6:1123–32. 10.1038/ni1254 - DOI - PubMed

Publication types

MeSH terms