. 2019 Apr 24:6:17.
doi: 10.3389/fmolb.2019.00017. eCollection 2019.

Evaluating and Correcting Inherent Bias of microRNA Expression in Illumina Sequencing Analysis

Affiliations

Evaluating and Correcting Inherent Bias of microRNA Expression in Illumina Sequencing Analysis

Anne Baroin-Tourancheau et al. Front Mol Biosci. .

Abstract

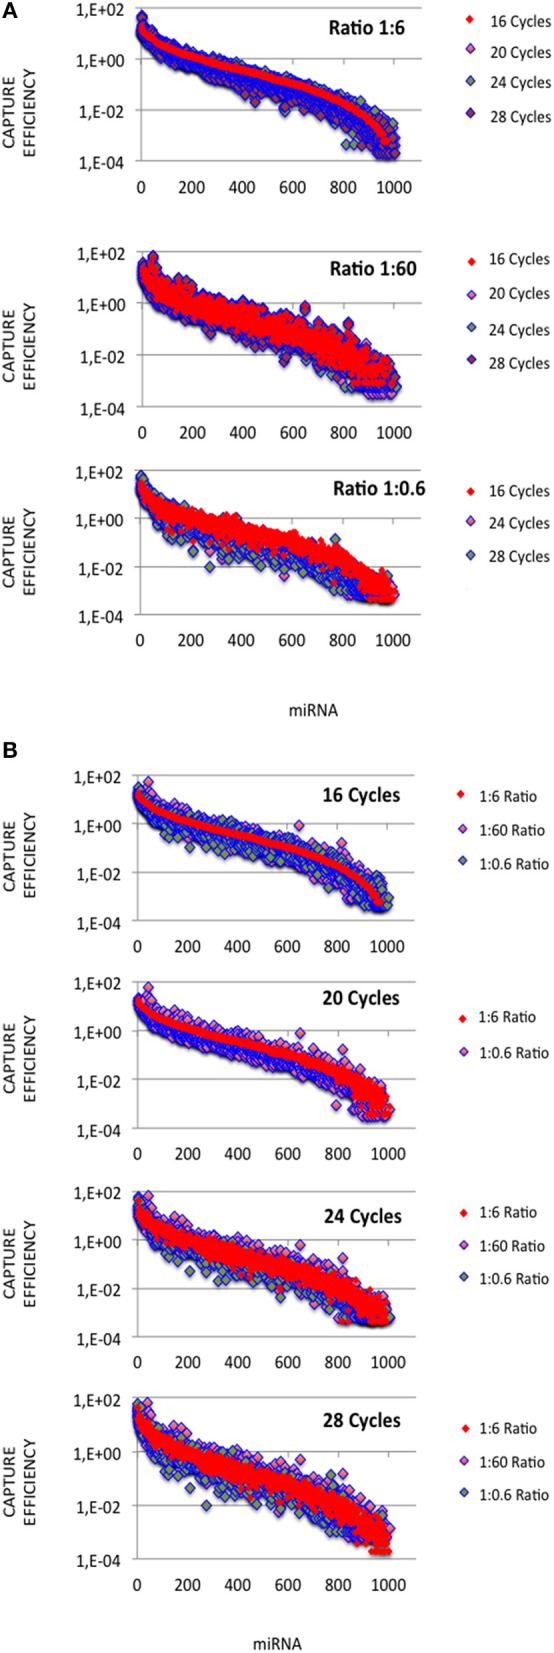
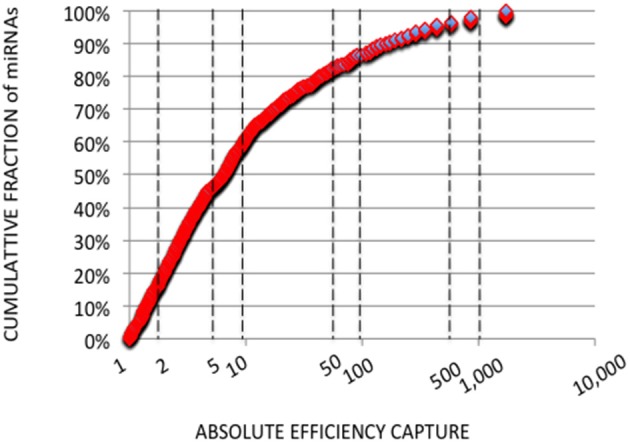
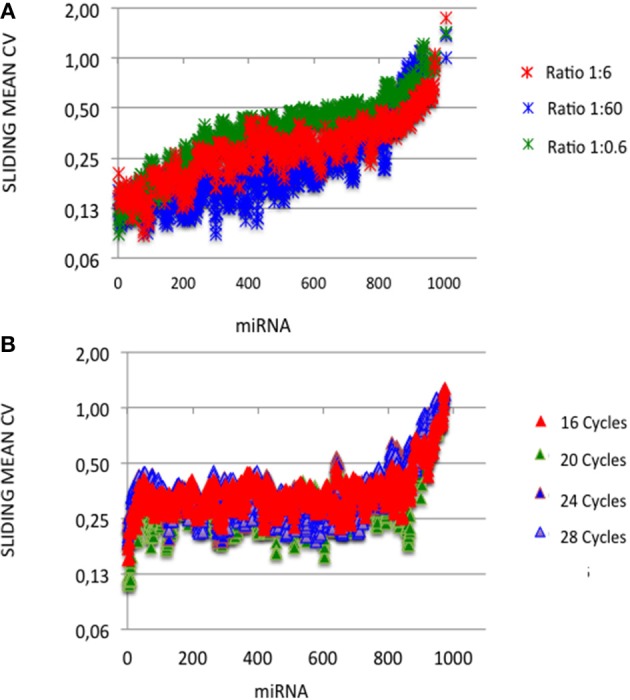
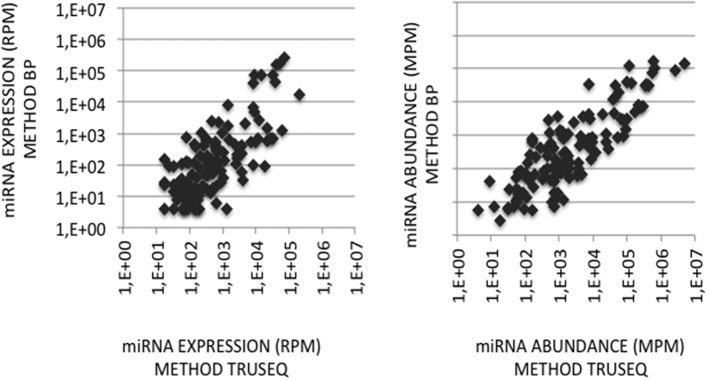
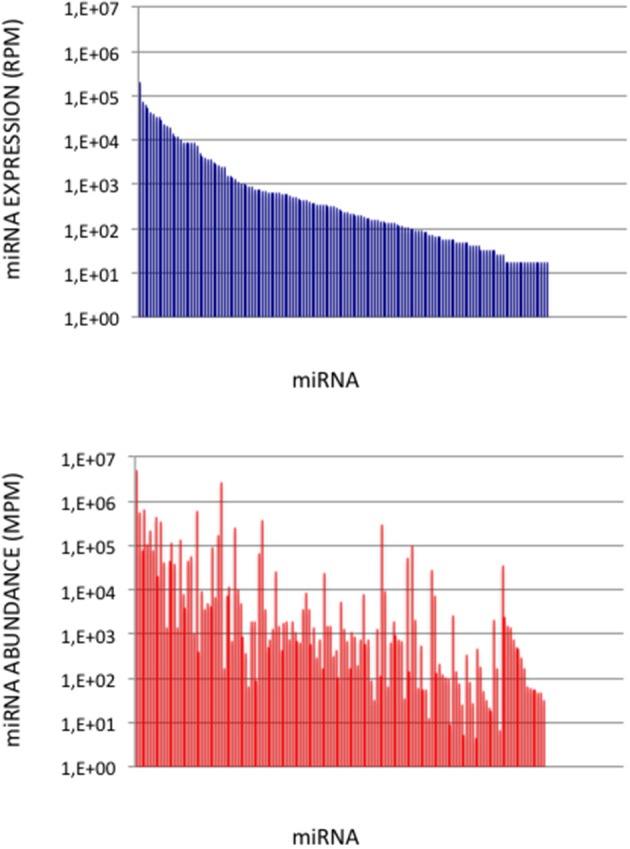
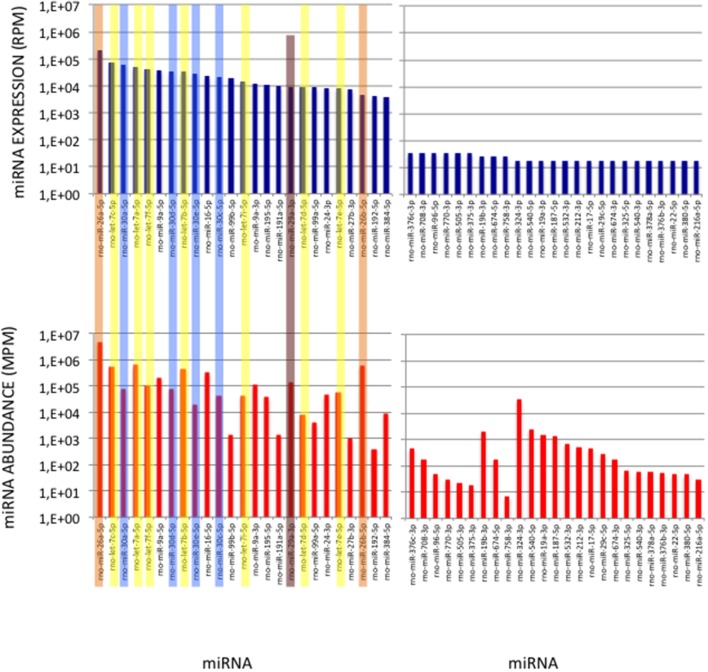
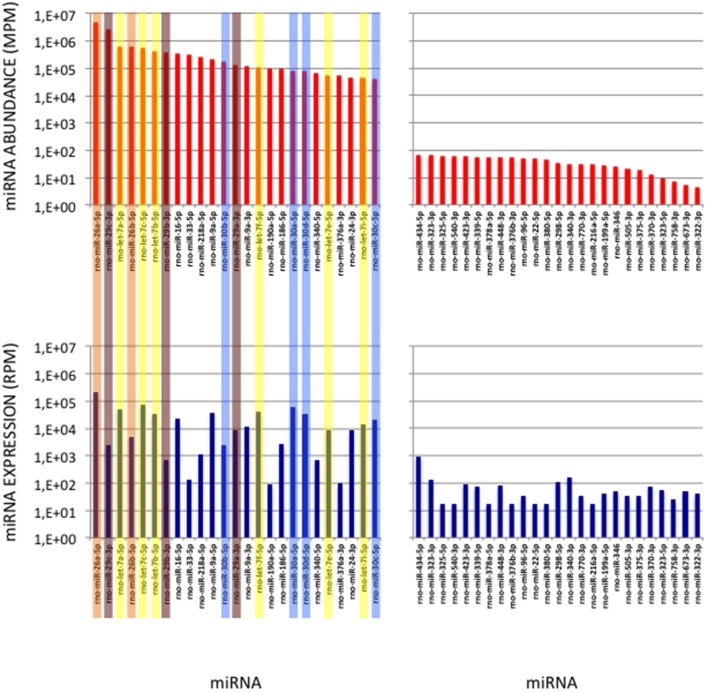
microRNA (miRNA) expression profiles based on the highly powerful Illumina sequencing technology rely on the construction of cDNA libraries in which adaptor ligation is known to deeply favor some miRNAs over others. This introduces erroneous measurements of the miRNA abundances and relative miRNA quantities in biological samples. Here, by using the commercial miRXplore Universal Reference that contains an equimolar mixture of 963 animal miRNAs and TruSeq or bulged adaptors, we describe a method for correcting ligation biases in expression profiles obtained with standard protocols of cDNA library construction and provide data for quantifying the true miRNA abundances in biological samples. Ligation biases were evaluated at three ratios of miRNA to 3'-adaptor and four numbers of polymerase chain reaction amplification cycles by calculating efficiency captures/correcting factors for each miRNA. We show that ligation biases lead to over- or under-expression covering a 105 amplitude range. We also show that, at each miRNA:3'-adaptor ratio, coefficients of variation (CVs) of efficiency captures calculated over the four number of amplification cycles using sliding windows of 10 values ranged from 0.1 for the miRNAs of high expression to 0.6 for the miRNAs of low expression. Efficiency captures of miRNAs of high and low expression in profiles are therefore differently impacted by the number of amplification cycles. Importantly, we observed that at a given number of amplification cycles, CVs of efficiency captures calculated over the three miRNA:3'-adaptor ratios displayed a steady value of 0.3 +/- 0.05 STD for miRNAs of high and low expression. This allows, at a given number of amplification cycles, accurate comparison of miRNA expression between biological samples over a substantial expression range. Finally we provide tables of correcting factors that allow to measure the abundances of 963 miRNAs in biological samples from TruSeq-based expression profiles and, an example of their use by characterizing miRNAs of the let-7, miR-26, miR-29, and miR-30 families as the more abundant miRNAs of the rat adult cerebellum.

Keywords: Illumina technology; cerebellum; high-throughput sequencing; ligation bias; miRNA abundance; miRNA expression profile.


Figures

Figure 1
Figure 1
miRNA capture efficiencies extend over a 105 amplitude range. cDNA libraries were built from equimolar miRNA amounts with ratios of miRNA:3′ adaptor of 1:0.6, 1:6 or 1:60, and 16, 20, 24, or 28 amplification cycles. For each miRNA:3′ adaptor ratio and each amplification cycle number, we quantified the efficiency of capture (EC) of each miRNA by dividing the miRNA expression frequency (i.e., miRNA reads/sum of miRNA reads) by the miRNA abundance in the sample (i.e., 1/1006). ECs are plotted for different miRNA:3′ adaptor ratios (A) or different amplification cycle numbers (B). miRNAs were identically ordered on the X-axes of the plots of (A,B). This order was obtained by sorting ECs calculated from the expression profile established when using the miRNA:3′ adaptor ratio of 1:6 and 16 amplification cycles (see Supplemental Table S3). Y-axes are drawn using a log10 scale. Note that the values of ECs largely overlap in each plot.
Figure 2
Figure 2
Cumulative Analysis of miRNA Capture Efficiencies. Cumulative fractions of miRNA (Y-axis) were plotted against absolute ECs (X-axis) calculated from the expression profile with a miRNA:3′ adaptor ratio of 1:6 and 16 amplification cycles. Absolute ECs were defined as maximal values between ECs and 1/ECs so that over- and under-expressions are collapsed (ECs of 50 and 0.02 for example). The X-axis is drawn using a log10 scale. About 60 and 85% of the miRNAs displayed absolute ECs lower than 10 or 100, respectively. About 40 and 15% of the miRNAs displayed absolute ECs higher than 10 or 100, respectively, and would artifactually appear as over- or under-abundant.
Figure 3
Figure 3
Capture efficiency robustness. We analyzed the robustness of ECs by plotting mean coefficients of variation (CVs) of ECs calculated built over sliding windows of 10 values using different miRNA:3′ adaptor ratios (A) or different amplification cycle numbers (B). miRNAs were ordered as in Figures 1, 2. Y-axes are drawn using a log2 scale. Note that the values of ECs largely overlap in each plot.
Figure 4
Figure 4
miRNA quantification in cerebellum. (Left Graph) miRNA expression profiles were established following the sequencing of two cDNA libraries constructed from the same cerebellum RNA sample and Illumina-based protocol but with 3′-adaptors RA3 (current TruSeq protocol) or BC8 (previous protocol). miRNA expressions in the BC8 profile were plotted against miRNA expressions in the RA3 profile. Data are expressed in Reads per Million (RPM). Both variables display a Pearson coefficient of correlation R2 of 0.54. (Right Graph) miRNA abundances in the cerebellum sample were calculated from each miRNA expression profile corrected with its corresponding ECs/correcting factors. miRNA abundances in the sample obtained using ECs/correcting factors BC8 were plotted against miRNA abundances calculated using ECs/correcting factors TruSeq. Data are expressed in Molecules per Million (MPM). Both variables display a Pearson coefficient of correlation R2 of 0.71. X- and Y-axes are drawn using a log10 scale.
Figure 5
Figure 5
miRNA Abundances in Cerebellum. (Upper Graph) miRNA expressions ordered by decreasing values in the cerebellum expression profile. Data are expressed in Reads per Million (RPM). (Lower Graph) miRNA abundances in the cerebellum sample. miRNAs are ordered as in the upper graph. Data are expressed in Molecules per Million (MPM).
Figure 6
Figure 6
miRNAs of High Expression in the Cerebellum profile. (Upper Graphs) Expressions of the first and last 25 miRNAs in the cerebellum expression profile are shown, ordered by decreasing values. Data are expressed in Reads per Million (RPM). (Lower Graphs) Corresponding abundances in the cerebellum sample. miRNAs are ordered as in the upper graphs. Data are expressed in Molecule per Million (MPM). Five of the 25 more expressed miRNAs (>38,000 RPM) and 8 of the 25 less expressed miRNAs (< 100 RPM) in the expression profile turn to display similar abundances (400 < MPM < 4,000) in the sample. Members of the let-7, miR-26, miR-29, and miR-30 families are pictured in yellow, orange, purple, and blue, respectively.
Figure 7
Figure 7
miRNAs of High Abundance in the Cerebellum Sample. (Upper Graphs) Abundances of the first and last 25 miRNAs in the cerebellum sample are shown, ordered by decreasing values. All 5p-members of the miR-26 and miR-29 families appear highly abundant (ranks < rank 14). Data are expressed in Molecules per Million (MPM). (Lower Graphs) Corresponding expressions in the cerebellum expression profile. Data are expressed in Reads per Million (RPM). miRNAs are ordered as in the upper graphs. Members of the let-7, miR-26, miR-29 and miR-30 families are pictured in yellow, orange, purple and blue, respectively.

References

    1. Baran-Gale J., Kurtz C. L., Erdos M. R., Sison C., Young A., Fannin E. E., et al. . (2015). Addressing bias in small RNA library preparation for sequencing: a new protocol recovers microRNAs that evade capture by current methods. Front. Genet. 6:352. 10.3389/fgene.2015.00352 - DOI - PMC - PubMed
    1. Baroin-Tourancheau A., Benigni X., Doubi-Kadmiri S., Taouis M., Amar L. (2016). Lessons from microRNA sequencing using Illumina technology. Adv. Biosci. Biotechnol. 7, 319–328. 10.4236/abb.2016.77030 - DOI
    1. Bitetti A., Mallory A. C, Golini E., Carrieri C., Carre-o Gutiérrez H., Perlas E., et al. . (2018). microRNA degradation by a conserved target RNA regulates animal behavior. Nat Struct Mol Biol. 25, 244–251. 10.1038/s41594-018-0032-x - DOI - PubMed
    1. Fuchs R. T., Sun Z., Zhuang F., Robb B. (2015). Bias in ligation-based small RNA sequencing library construction is determined by adaptor and RNA structure. PLoS ONE. 10:e0126049. 10.1371/journal.pone.0126049 - DOI - PMC - PubMed
    1. Garalde D. R., Snell E. A., Jachimowicz D., Sipos B., Lloyd J. H., Bruce M., et al. . (2018). Highly parallel direct RNA sequencing on an array of nanopores. Nat. Methods 15, 201–206. 10.1038/nmeth.4577 - DOI - PubMed