. 2018 Jun 21;2(3):032002.
doi: 10.1063/1.5020992. eCollection 2018 Sep.

Multi-sample deformability cytometry of cancer cells

Affiliations

Multi-sample deformability cytometry of cancer cells

Shamim M Ahmmed et al. APL Bioeng. .

Abstract

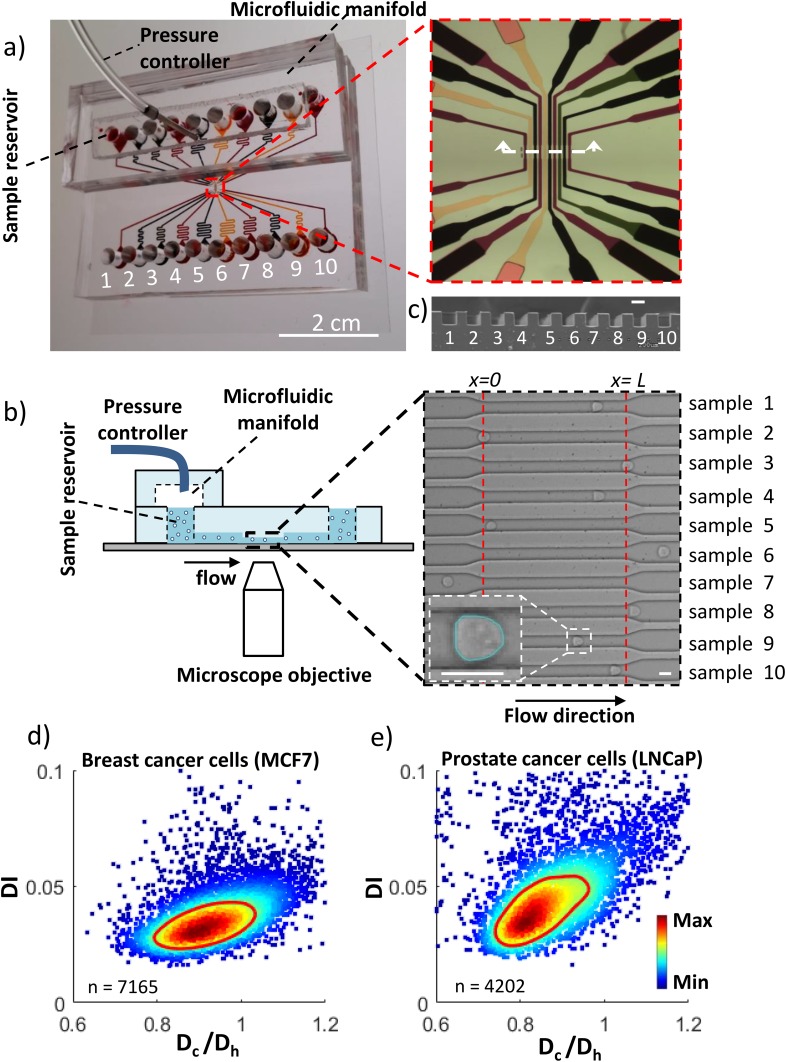
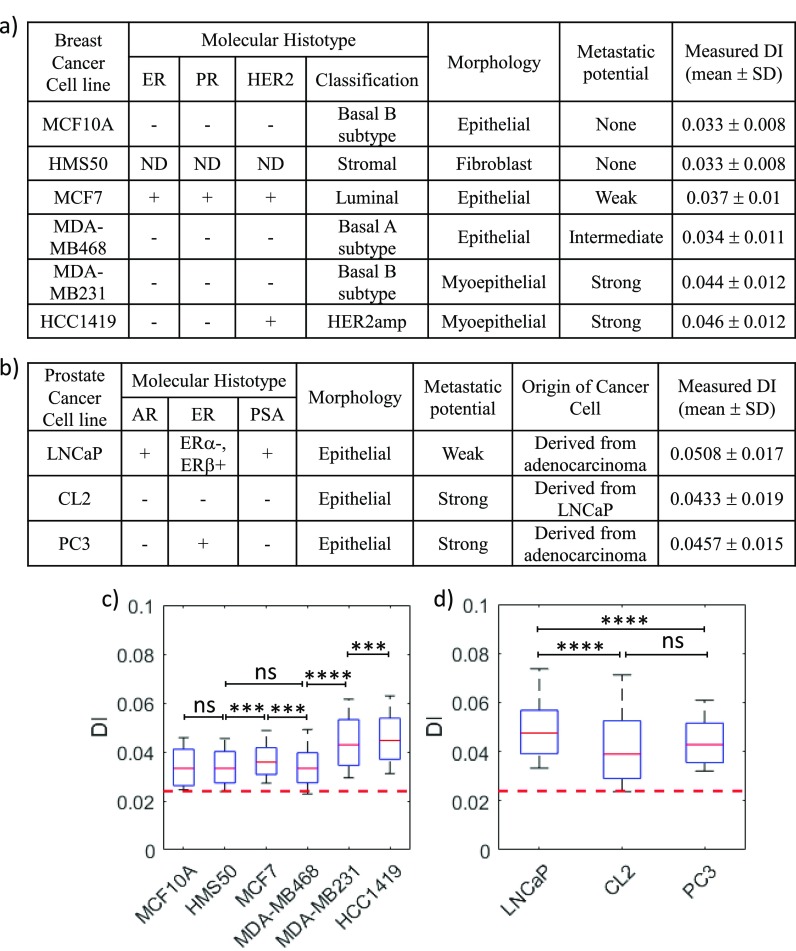
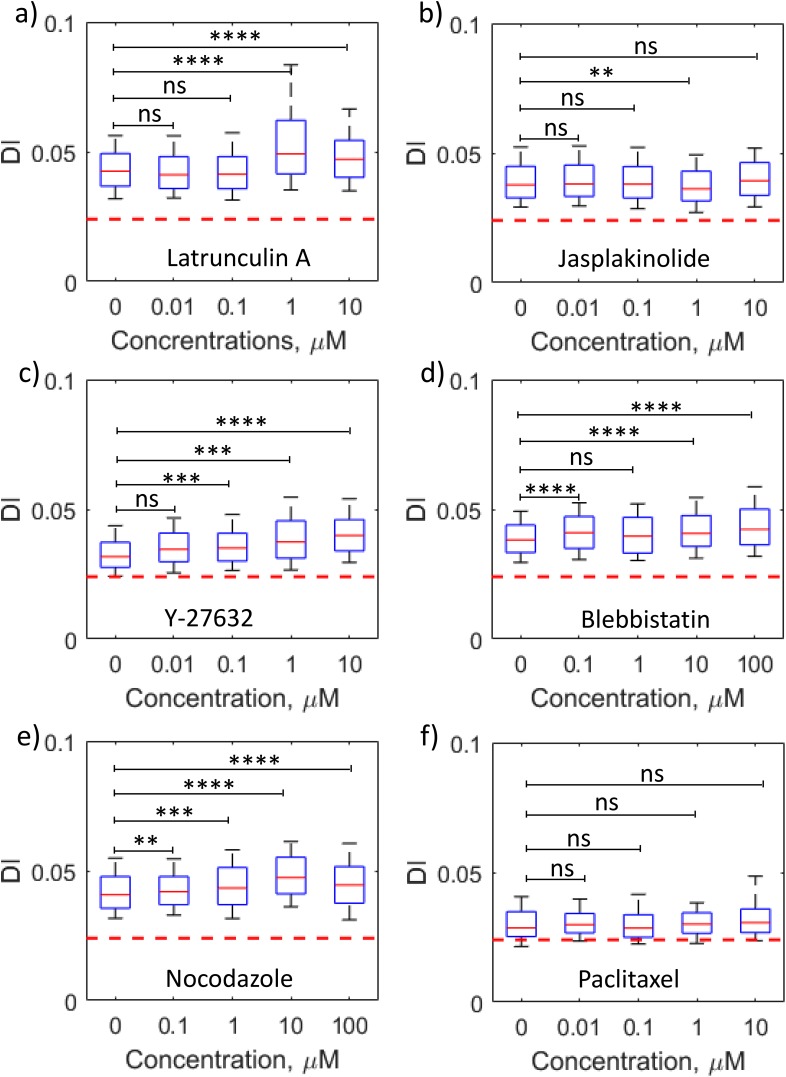
There is growing recognition that cell deformability can play an important role in cancer metastasis and diagnostics. Advancement of methods to characterize cell deformability in a high throughput manner and the capacity to process numerous samples can impact cancer-related applications ranging from analysis of patient samples to discovery of anti-cancer compounds to screening of oncogenes. In this study, we report a microfluidic technique called multi-sample deformability cytometry (MS-DC) that allows simultaneous measurement of flow-induced deformation of cells in multiple samples at single-cell resolution using a combination of on-chip reservoirs, distributed pressure control, and data analysis system. Cells are introduced at rates of O(100) cells per second with a data processing speed of 10 min per sample. To validate MS-DC, we tested more than 50 cell-samples that include cancer cell lines with different metastatic potential and cells treated with several cytoskeletal-intervention drugs. Results from MS-DC show that (i) the cell deformability correlates with metastatic potential for both breast and prostate cancer cells but not with their molecular histotype, (ii) the strongly metastatic breast cancer cells have higher deformability than the weakly metastatic ones; however, the strongly metastatic prostate cancer cells have lower deformability than the weakly metastatic counterparts, and (iii) drug-induced disruption of the actin network, microtubule network, and actomyosin contractility increased cancer cell deformability, but stabilization of the cytoskeletal proteins does not alter deformability significantly. Our study demonstrates the capacity of MS-DC to mechanically phenotype tumor cells simultaneously in many samples for cancer research.


Figures

FIG. 1.
FIG. 1.
Microfluidic setup for multi-sample deformability cytometry. (a) Image of the microfluidic device showing the microfluidic channel (dyed with different colors), sample reservoirs, outlet from the pressure controller, and microfluidic manifold. The inset shows the zoomed in view of ten independent microchannels. (b) Schematic of the experimental setup. The inset is the bright field image with cells flowing through the channels. The dashed lines represent the length L of the test section of the channel. Detected boundary of a deformed cell inside the microchannel is also shown in the bottom left corner of the inset. (c) SEM image of the cross-section of the test channels showing the nearly square cross-section. The scale bar is 18 μm. Scatter density plot of the deformation index (DI) as a function of cell diameter normalized by the hydraulic diameter of the channel of (d) breast cancer cells MCF7 (n = 7164) and (e) prostate cancer cells LNCaP (n = 4202) analyzed from a 5.86 s-long recorded video for each of the cell systems using a driving pressure of 15 kPa. The color indicates the linear density scale and the red line is the contour of the 50% maximal event density.
FIG. 2.
FIG. 2.
Characterization of the microfluidic manifold and deformability measurements. (a) Mean velocity of monodisperse rigid polystyrene (PS) beads of a mean diameter of 15.13 μm in each of the ten channels for an applied driving pressure of 5 kPa in the microfluidic manifold. The mean velocity was calculated from 20 to 200 particles. The horizontal line is the average of the velocity of PS beads in all the channels and the error bar indicates one standard deviation. (b) Scattered density plot of the deformation index (DI) of PS beads as a function of bead's diameter normalized by the hydraulic diameter of the channel. The red line is the 50% event density contour. The maximum measured DI of PS beads is 0.024. Although most of the beads have lower DI than the maximum value, we take 0.024 as the maximum error in DI measurements in our MS-DC technique.
FIG. 3.
FIG. 3.
Influence of driving pressure on the deformation behavior of cells in MS-DC. (a) Three point moving average of DI as a function of x-position in the channel for the breast cancer cell line MCF7 at driving pressures 10 kPa (black triangles), 15 kPa (blue circles), 25 kPa (red squares), and 30 kPa (purple diamonds). Each data point on the curves is the mean DI of ≥52 cells taken from all of the ten channels with cell size 0.85 < Dc/Dh < 0.95. The vertical dashed line represents the length L of the test section of the channel. (b) DI as a function of driving pressure for the breast cancer cell line MCF7. Each point represents the measured mean DI of the cells (≥52) with the same bin size 0.85 < Dc/Dh < 0.95 and the connected line is the linear fit of the data with R2 = 0.9303. The horizontal dashed lines show the maximum error limit in DI measurements.
FIG. 4.
FIG. 4.
Deformability-based mechanical phenotyping of breast and prostate cancer cells. The metastatic potential, histotype, morphology, origin of the cell lines, and measured DI of six breast cancer cells (a) and three prostate cancer cells (b) are summarized (ER, Estrogen Receptor; PR, Progesterone Receptor; ND, Not determined; AR, Androgen Receptor; and PSA, Prostate Serum Antigen). The boxplots represent the size-gated distribution (0.85 < Dc/Dh < 0.95) of the measured DI of breast cancer cell lines (c) and prostate cancer cell lines (d). The driving pressure is 15 kPa for all the cell lines. The central red line in the box represents the median, the bottom, and the top edges of the box indicate the 25th and 75th percentiles, and the whiskers represent the 10th and 90th percentiles. In the boxplot, n >100 for all the cell lines. Scatter density plots of DI versus cell size are shown in supplementary material Fig. S1 for these cell lines. The statistical significance was determined using the one-tailed Mann-Whitney U test with a significance level of 0.01: ns (p > 0.01); *** (p < 0.0001); and **** (p < 0.00001). The horizontal dashed line in (c) and (d) shows the maximum error limit in DI measurements.
FIG. 5.
FIG. 5.
Parallelized drug dose-response analysis of cancer cells using MS-DC. The boxplots represent the size-gated (0.85 < Dc/Dh < 0.95) distribution of measured DI of breast cancer cell line MCF7 treated with actin network intervening drugs (a) Latrunculin A, (b) Jasplakinolide, (c) Y-27632, and (d) Blebbistatin and microtubule intervening drugs (e) Nocodazole and (f) Paclitaxel. The driving pressure is 15 kPa. The central red line in the box represents the median, the bottom, and the top edges of the box indicate the 25th and 75th percentiles, and the whiskers represent the 10th and 90th percentiles. In the boxplot, n ≥ 100 for all the drug concentrations. Representative scatter density plots of DI versus cell size for Latrunculin A are shown in supplementary material Fig. S2. The statistical significance was determined using the one-tailed Mann-Whitney U test with a significance level of 0.01: ns (p > 0.01); ** (p < 0.001); *** (p < 0.0001); and **** (p < 0.00001). The horizontal dashed line in (a)–(f) shows the maximum error limit in DI measurements.

References

    1. Gossett D. R., Tse H. T. K., Lee S. A., Ying Y., Lindgren A. G., Yang O. O., Rao J., Clark A. T., and Di Carlo D., Proc. Natl. Acad. Sci. 109(20), 7630–7635 (2012). 10.1073/pnas.1200107109 - DOI - PMC - PubMed
    1. Lange J. R., Steinwachs J., Kolb T., Lautscham L. A., Harder I., Whyte G., and Fabry B., Biophys. J. 109(1), 26–34 (2015). 10.1016/j.bpj.2015.05.029 - DOI - PMC - PubMed
    1. Zhang W., Kai K., Choi D. S., Iwamoto T., Nguyen Y. H., Wong H., Landis M. D., Ueno N. T., Chang J., and Qin L., Proc. Natl. Acad. Sci. 109(46), 18707–18712 (2012). 10.1073/pnas.1209893109 - DOI - PMC - PubMed
    1. Nyberg K. D., Hu K. H., Kleinman S. H., Khismatullin D. B., Butte M. J., and Rowat A. C., Biophys. J. 113(7), 1574–1584 (2017). 10.1016/j.bpj.2017.06.073 - DOI - PMC - PubMed
    1. Khan Z. S. and Vanapalli S. A., Biomicrofluidics 7(1), 011806 (2013). 10.1063/1.4774310 - DOI - PMC - PubMed